
Statistics Canada
www.statcan.gc.ca
Common menu bar links
 View the most recent version.
Archived Content
Information identified as archived is provided for reference, research or recordkeeping purposes. It is not subject to the Government of Canada Web Standards and has not been altered or updated since it was archived. Please contact us to request a format other than those available.
2006 Census: Portrait of the Canadian Population in 2006: Subprovincial population dynamics
Three large urban areas: the Montréal and Vancouver CMAs and the Greater Golden Horseshoe
In 2006, nearly half of all Canadians, 13.9 million people, were living in the country's three largest urban areas: the Montréal census metropolitan area, the Vancouver census metropolitan area, and the Greater Golden Horseshoe in southern Ontario.
Between 2001 and 2006, the population of these areas grew by 950,000 representing more than half of Canada's total population growth (+1.6 million). This growth rate (+7.3%) was above the national average (+5.4%) for the period.
 The large urban centres of Montréal, Vancouver and the Greater Golden Horseshoe have a number of special demographic characteristics. For example, population growth is largely due to international immigration along with the pull these larger urban areas exert on the younger working age adults from other parts of the country who are likely to move there for economic reasons.
What also sets them apart is the fact that these metropolitan areas encompass large municipalities that are home to hundreds of thousands of people. Some municipalities located on the fringes of the municipalities of Montréal, Toronto and Vancouver have larger populations compared with many of the country's census metropolitan areas.
It is important to differentiate between census metropolitan areas (CMAs) and municipalities that form census subdivisions (CSDs). CMAs usually consist of many municipalities, one of which, called the central municipality, lends its name to the CMA. For example, the Montréal CMA includes nearly 100 municipalities, such as Laval, Longueuil, La Prairie and Mirabel. The municipality of Montréal, on the island of Montréal, is the central municipality, that is the census subdivision for which the CMA is named.
Of the 25 municipalities with the largest populations in Canada, nine are on the fringes of Montréal, Toronto or Vancouver2. Included, for example, are Mississauga (668,549), a suburb of Toronto; Surrey (394,976), a suburb of Vancouver; and Laval (368,709), a suburb of Montréal. The growth rate of these municipalities varies widely, even within the larger urban areas of which they form part.

Table 4 Most populous municipalities of Canada in 2006
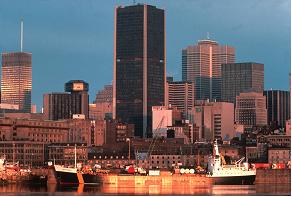
Montréal CMA
Half of Quebec's population lives in the Montréal CMA
Canada's most populous metropolitan area prior to the 1976 Census, the Montréal CMA is now, with its population of 3.6 million, the second-largest CMA after Toronto. It still has considerable demographic significance for Quebec, as it is home to nearly half of the 7.5 million Quebecers enumerated in 2006.
 Between 2001 and 2006, the Montréal CMA's population grew by 5.3%, slightly more rapidly than Quebec's population (+4.3%). International immigration was the main factor in the CMA's population growth as over the five year period it experienced a net loss in its migration exchanges with the other parts of the country.
The Montréal CMA encompasses nearly 100 municipalities with widely varying populations and growth rates. It includes municipalities with large populations, such as the municipality of Montréal (1.6 million), the municipality of Laval (368,709, the third-largest municipality in Quebec) and the municipality of Longueuil (229,330, the fifth-largest municipality in Quebec). In contrast, municipalities such as Senneville, Pointe-des-Cascades and Vaudreuil-sur-le-Lac had a population of less than 2,000 each.
Since 2001, the growth of the various municipalities located in the Montréal CMA has also varied. About 30 municipalities, with a total population of nearly half a million, experienced a growth rate of at least twice the national average. Among them are Vaudreuil-Dorion (+29.5%) to the west; Saint-Colomban (+34.8%), Blainville (+29.0%), Mirabel (+26.8%), Terrebonne (+17.6%) and Mascouche (+14.2%) to the north; St-Basile-le-Grand (+26.0%) to the east; and Candiac (+25.8%), La Prairie (+15.2%) and Chambly (+11.1%) to the south. All of these are located on the periphery of the island of Montréal, in some cases close to major highways, and most are adjacent to the CMA's boundaries.

Montréal CMA. Population Change, 2001 to 2006, by 2006 Census Subdivision
On the island of Montréal, the growth rate of every municipality except Montréal-est was lower than the provincial average of 4.3%. That was the case for the city of Montréal, as its population grew by 2.3% between 2001 and 2006.
This pattern of development in urban centres, where the population of peripheral municipalities grows faster than that of the central municipality, is typical of urban spread (Flash).
It is also worth noting that Montréal's two largest suburbs, Longueuil and Laval, showed very different growth patterns since 2001. Longueuil's population was 229,330 in 2006, up slightly (+1.6%) from 2001. Laval's population grew much more quickly (+7.5%), reaching 368,709 in 2006. In fact, its 7.5% growth rate was higher than that of any other CMA in Quebec.
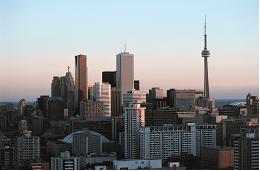
Greater Golden Horseshoe
Two-thirds of Ontarians live in the Greater Golden Horseshoe region
Extending along the western end of Lake Ontario, the Greater Golden Horseshoe is both the most populous and the most heavily urbanized region in Canada. It is home to 8.1 million people, two-thirds of Ontarians and one-quarter of all Canadians. It contains nine of the country's 33 census metropolitan areas and many census agglomerations.
 The population of this major urban area grew by 630,631 between 2001 and 2006, and its growth rate of 8.4% was faster than the provincial average of 6.6%. Thus, the Greater Golden Horseshoe accounted for 84% of Ontario's population increase and 39% of the total national increase. International immigration is the main reason for the region's high population growth rate.
The Greater Golden Horseshoe consists of more than 100 municipalities, 16 of which have a population of more than 100,000. In 2006, the municipality of Toronto was the most populous, with 2.5 million people, followed by Mississauga (668,549), Hamilton (504,559) and Brampton (433,806). The other municipalities with more than 100,000 residents are Markham, Vaughan, Kitchener, Oakville, Burlington, Richmond Hill, Oshawa, St. Catharines, Barrie, Cambridge, Guelph and Whitby.
Eleven of the 16 municipalities with a population of more than 100,000 are in a corridor that runs from Hamilton to Oshawa. That corridor is the largest continuous urban network in Canada, and it is home to more than 5.3 million people, roughly one-sixth of Canadians.
Greater Golden Horseshoe. Population Change, 2001 to 2006, by 2006 Census Subdivision
Over the 2001 to 2006 period, five municipalities in the Hamilton-Oshawa corridor with a 2006 population of more than 100,000 had a population growth rate at least four times the national average (+5.4%): Brampton (+33.3%), Vaughan (+31.2%), Whitby (+27.2%), Markham (+25.4%) and Richmond Hill (+23.2%). Four of them are located just north of the city of Toronto.
Other large municipalities that are part of the Greater Golden Horseshoe also underwent rapid population growth since 2001. Among them are Milton (+71.4%), Barrie (+23.8%), Ajax (+22.3%), Aurora (+18.6%), Halton Hills (+14.7%), Oakville (+14.4%), Newmarket (+12.9%), Caledon (+12.7%), Waterloo (+12.6%), Clarington (+11.4%) and Mississauga (+9.1%).
Some municipalities experienced more modest growth between 2001 and 2006, including St. Catharines (+2.2%), Oshawa (+1.8%) and Toronto (+0.9%). Kitchener (+7.5%) also had a lower growth rate than the Greater Golden Horseshoe as a whole.
The rapid growth of Brantford and Waterloo to the west, Barrie to the north and Clarington to the east suggests that urban spread in the region (Flash) will continue.
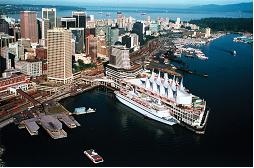
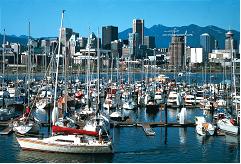
Vancouver CMA
More than half of British Columbia's residents live in the Vancouver CMA
The third-largest metropolitan area in Canada for many years, Vancouver passed the 2 million mark for the first time in 2006. British Columbia's biggest city, it is home to more than half of the province's population.
 Though the province experienced net losses in its migration exchanges with the rest of the country, especially other parts of British Columbia, Vancouver is the destination of many international immigrants. Between 2001 and 2006, an average of 25,000 immigrants a year settled in the Vancouver area. Because of international immigration, Vancouver continued to experience a higher population growth rate than the provincial average in the 2001 to 2006 period (6.5% versus 5.3%).
The Vancouver area is made up of about 40 municipalities, five of which have a population of more than 100,000. The municipality of Vancouver is the largest, with a population count of 578,041 in the 2006 Census, followed by Surrey (394,976), Burnaby (202,799), Richmond (174,461) and Coquitlam (114,565).
Vancouver CMA. Population Change, 2001 to 2006, by 2006 Census Subdivision
Municipalities located within the Vancouver CMA are growing at different rates (Flash). Between 2001 and 2006, growth was particularly rapid in municipalities in the eastern and southern parts of the Vancouver CMA, especially Maple Ridge (+9.2%), Langley (+6.1%), New Westminster (+7.1%), Port Moody (+15.5%) and Surrey (+13.6%). Their growth rates were all above the national, provincial and Vancouver CMA's averages for the 2001 to 2006 period.
The municipalities of Burnaby (+4.6%) and Coquitlam (+1.5%) grew more slowly than the provincial average (+5.3%) since 2001. Richmond's population growth rate was higher, at 6.2%.