
Health Canada
www.hc-sc.gc.ca
Common menu bar links
Institutional links
2012-13 - Departmental Performance Report (DPR)
Table of Contents
- Erratum - Health Canada 2012-13 Departmental Performance Report
- Minister's Message
- Section I: Organizational Overview
- Section II: Analysis of Programs and Sub-Programs by Strategic Outcomes
- Strategic Outcome 1:
A Health System Responsive to the Needs of Canadians- Program 1.1: Canadian Health System
- Sub-Program Reporting 1.1.1 Health System Priorities
- Sub-Program Reporting 1.1.2 Canada Health Act Administration
- Sub-Program Reporting 1.1.3 Emergent Health Issues
- Sub-Program Reporting 1.1.4 International Health Partnerships
- Program 1.2: Specialized Health Services
- Sub-Program Reporting 1.2.1 Public Service Occupational Health and Safety
- Sub-Program Reporting 1.2.2 Emergency Management
- Program 1.3: Official Language Minority Community Development
- Strategic Outcome 2:
- Program 2.1: Health Products
- Sub-Program Reporting 2.1.1 Pharmaceutical Drugs
- Sub-Program Reporting 2.1.2 Biologics and Radiopharmaceuticals
- Sub-Program Reporting 2.1.3 Medical Devices.
- Sub-Program Reporting 2.1.4 Natural Health Products
- Program 2.2: Food Safety and Nutrition
- Sub-Program Reporting 2.2.1 Food Safety
- Sub-Program Reporting 2.2.2 Nutrition and Healthy Eating
- Program 2.3: Environmental Risks to Health
- FSDS Performance Summary
- Sub-Program Reporting 2.3.1 Climate Change.
- Sub-Program Reporting 2.3.2 Air Quality
- Sub-Program Reporting 2.3.3 Water Quality
- Sub-Program Reporting 2.3.4 Health Impacts of Chemicals
- Sub-Program Reporting 2.3.5 Public Health Inspections on Passenger Conveyances
- Program 2.4: Consumer Product Safety
- Program 2.5: Substance Use and Abuse
- Sub-Program Reporting 2.5.1 Tobacco
- Sub-Program Reporting 2.5.2 Controlled Substances
- Program 2.6: Radiation Protection
- FSDS Performance Summary
- Sub-Program Reporting 2.6.1 Environmental Radiation Monitoring and Protection
- Sub-Program Reporting 2.6.2 Radiation Emitting Devices
- Sub-Program Reporting 2.6.3 Dosimetry Services
- Program 2.7: Pesticide Safety
- Strategic Outcome 3:
- Program 3.1: First Nations and Inuit Primary Health Care
- FSDS Performance Summary
- Sub-Program Reporting 3.1.1 First Nations and Inuit Health Promotion and Disease Prevention
- Sub-Program Reporting 3.1.2 First Nations and Inuit Public Health Protection
- Sub-Program Reporting 3.1.3 First Nations and Inuit Primary Care
- Program 3.2: Supplementary Health Benefits for First Nations and Inuit
- Program 3.3: Health Infrastructure Support for First Nations and Inuit
- Sub-Program Reporting 3.3.1 First Nations and Inuit Health System Capacity
- Sub-Program Reporting 3.3.2 First Nations and Inuit Health System Transformation
- Internal Services
- Strategic Outcome 1:
- Section III: Supplementary Information
- Section IV: Other Items of Interest
Erratum - Health Canada 2012-13 Departmental Performance Report
Subsequent to tabling in Parliament and online publication of the 2012-13 Departmental Performance Report, a transcription error was found in the Financial Resources table for Sub-Program 3.3.1 in Section II of the report.
In this table, the Actual Spending amount reported should have read $246.5M instead of $249.4M.
The English and French HTML versions of the 2012-13 Departmental Performance Report have been revised to include the correct values.
Minister's Message

As Canada's Minister of Health, I am pleased to present Health Canada's 2012-2013 Departmental Performance Report which outlines the actions Health Canada has taken to strengthen Canada's healthcare system and improve the health of Canadians.
Federal health transfers will reach a record high of $30.3 billion this year and will continue to grow to more than $40 billion by the end of the decade. These are the highest healthcare transfer levels in Canadian history and provide financial predictability for the provinces and territories.
Health Canada protected and promoted the health of Canadians by ensuring that the food that Canadians eat and the products they use are as safe as possible. Amendments to the Food and Drugs Act were adopted that will continue to protect Canadian food safety, while reducing red tape that currently delays safe foods from getting to market.
To help prevent adverse drug reactions, medication errors and protect Canadian patients, we have introduced the Plain Language Labelling Initiative, which aims to improve the safe use of drugs by making drug labels and safety information easier to read and understand.
Another important initiative is the implementation of tougher labelling requirements for cigarettes and little cigars. Bold new, larger health warnings cover three-quarters of the front and back of the package and include important health and quitting information for smokers. Our Government's efforts have helped to bring smoking rates to an all-time low in Canada.
Health Canada continued its commitment to delivering better and more integrated healthcare to First Nations. The Non-Insured Health Benefits Program provided supplemental health benefits coverage to nearly 900,000 eligible Registered Indians and recognized Inuit. Efforts continue to modernize and align primary care through interdisciplinary health teams and expanded e-Health technologies to achieve sustainable, integrated, and high-quality health services and programs.
Through the BC Tripartite initiative, Health Canada, the British Columbia Ministry of Health and the BC First Nations Health Authority moved closer to realizing plans for a new, more responsive and integrated health governance structure.
Health Canada continues to implement strategies that focus attention and resources on areas that will provide the greatest potential benefits to Canadians both now and in the future.
The Honourable Rona Ambrose, PC., M.P.
Minister of Health
Section I: Organizational Overview
Raison d'être
Health Canada plays various roles that help Canadians to maintain and improve their health and contribute to strengthening Canada's record as a country with one of the healthiest populations in the world.
Responsibilities
First, as a regulator, Health Canada is responsible for the regulatory regimes governing the safety of products including food, pharmaceuticals, medical devices, natural health products, consumer products, chemicals, radiation emitting devices, cosmetics and pesticides. It also regulates tobacco products and controlled substances, public health on aircraft, ships and other passenger conveyances, and helps manage the health risks posed by environmental factors such as air, water, radiation and contaminants.
The department is also a service provider. For First Nations and Inuit, Health Canada supports: basic primary care services in remote and isolated communities and public health programs including communicable disease control (outside the Territories); home and community care; and, community-based health programs focusing on children and youth, mental health and addictions. The department also provides a limited range of medically-necessary, health-related goods and services to eligible First Nations and Inuit that are not otherwise provided through other public programs or private insurance plans.
Health Canada is a catalyst for innovation, a funder and an information provider in Canada's health system. It works closely with provincial and territorial governments to develop national approaches to health system issues, and promotes the pan-Canadian adoption of best practices. It administers the Canada Health Act, which embodies national principles to ensure a universal and equitable, publicly-funded health care system. It provides policy support for the federal government's Canada Health Transfer to provinces and territories, and provides funding through grants and contributions to various organizations to help meet overall health system objectives. The department draws on leading-edge science and policy research to generate and share knowledge and information to support decision-making by Canadians, the development and implementation of regulations and standards, and health innovation.
Strategic Outcomes and Program Activity Architecture (PAA)

*Note The Policy on MRRS recently underwent changes that came into effect on April 1, 2012. Updates have been made to the MRRS nomenclature. Specifically: “Program Activity Architecture” becomes “Program Alignment Architecture” (PAA);
“Program Activity” becomes “Program”; “Sub-Activity” becomes “Sub-Program”; and “Sub-Sub-Activity” becomes “Sub-Sub-Program.”
The Health Canada Program Alignment Architecture supports achievement of federal targets in three of four themes in the Federal Sustainable Development Strategy.
Organizational Priorities
Priority I - Promote Health System Innovation
Type : Ongoing
Strategic Outcome(s): 1
Why is this a priority?: The health care system is vital to addressing the health needs of Canadians wherever they live and whatever their financial circumstances. Given the importance of the health system to Canadians, Health Canada places a priority on working with partners to improve the effectiveness, efficiency and accountability of the system. Health Canada has an important contribution to make as the health system faces sustainability and other challenges from such issues as the growth of health technologies, shifting consumer demands, and demographic changes. Addressing these challenges requires leadership to ensure the availability of better health information and policy advice, and to engage effective inter-jurisdictional and inter-organizational cooperation. Innovation is needed to support health system sustainability.
Summary of Progress: Worked with provinces, territories and other health care partners to advance health system renewal and sustainability.
- Provided funds to support 21 projects that aim to improve health human resources planning and forecasting; use human resources skills effectively; and increase the number of health care providers.
- In addition to supporting Canada Health Infoway, Health Canada provided funding and strengthened collaborative working relationships with the Canadian Patient Safety Institute, to improve the culture of patient safety and building capacity in Canada's health care system; the Canadian Foundation for Healthcare Improvement; the Canadian Partnership Against Cancer to continue health system improvements in cancer control; the Mental Health Commission of Canada support improvements in Canada's mental health system with the release of the national mental health strategy title Changing Directions, Changing Lives and the completion of the At Home/Chez Soi “housing first” study; and the Canadian Blood Services to improve the performance of the organ and tissue donation and transplantation system in Canada.
- Announced $238.7 million in funding over three years to the Canadian Institute for Health Information (CIHI) to continue its work of providing reliable, comparable data about the health care system. As part of its work, CIHI is engaging with provinces and territories to develop a pan-Canadian approach to measuring health care system performance.
Facilitated the integration of internationally educated health professionals into the Canadian health workforce.
- Funding provided through the Internationally Educated Health Professionals Initiative (IEHPI) supported approximately 28 projects across all provinces and territories and four agreements with pan-Canadian organizations that are focused on improving workforce integration of internationally educated health professionals.
- IEHPI funding also supported the development of a common tool to assess an international medical graduate's preparedness for entry into post-graduate training. Partnerships are in place with five of the six centres conducting entry to residency assessments. In 2012, a total of 931 foreign-trained health professionals completed this entry to residency assessment.
Collaborated with stakeholder organizations to support health system innovation.
- Collaborated on the Drug Safety and Effectiveness Network with internal and external partners, and worked with partners like the Canadian Health Services Research Foundation, the Canadian Institute for Health Information and the Canadian Institutes of Health Research to address key health care knowledge gaps.
- Worked with the Brain Canada Foundation to advance the Canada Brain Research Fund. This Fund provides dollar-for-dollar matching funding to the Brain Canada Foundation to support Canadian neuroscience research and advance knowledge and treatment of brain disease and mental disorders.
Signed a contribution agreement with the Mood Disorders Society of Canada to undertake the development of a Canadian Depression Research and Intervention Network and a national Post-Traumatic Stress Disorder Continuing Medical Education training program.
Priority II - Modernize Health Protection Legislation and Programs
Type : Ongoing
Strategic Outcome(s): 2
Why is this a priority?: Health Canada is responsible for a regulatory regime for products in the everyday lives of Canadians, including consumer products, food, pharmaceuticals, medical devices, natural health products, chemicals, radiation emitting devices, cosmetics, and pesticides. As well, Health Canada helps to manage the risks posed by environmental factors, and the health implications of air quality, water quality, radiation, and environmental contaminants. Rapid technological change, the advent of products that blur traditional definitions, and incorporate innovative components, challenge Health Canada's ability to carry out its health and safety mandate. To address this challenge, Health Canada continued to modernize its regulatory programs.
Summary of Progress: Health Canada is the largest federal regulator and endeavors to minimize health risk factors and maximise the safety provided by the regulatory system for Canadians.
In line with this significant regulatory role, Health Canada:
Continued to protect the health and safety of Canadians while reviewing and updating our regulatory frameworks, reflecting the high volume and breadth of products regulated by the Department.
- Created a Roadmap that provides the vision to transform nearly a dozen current frameworks for food and health products, of various ages and regulatory approaches, into an efficient, transparent, and aligned regulatory system that contributes directly to the safety of Canadians and the benefits they gain from food and health products.
- Contributed to the Government of Canada's (GOC) efforts to reduce regulatory compliance burden.
- Recognizing the value of foreign regulatory information to Canadian health product market authorization reviews, Health Canada continued implementing a three-year plan (2011-13) to make more efficient, consistent and systematic use and integration of foreign regulatory information.
Streamlined regulatory processes by introducing new tools called "Marketing Authorizations" and "Incorporation by Reference” that maintain rigorous pre-market safety assessments to support Health Canada decisions and made a fair number of regulatory changes over the year. For example:
- Made regulatory and Schedule F amendments to the “Food and Drugs Act” and its regulation by publishing two proposals in Canada Gazette I (CGI) i.e. regulations amending the Food and Drug Regulations (1688 - Arsenic Trioxide).
- Published 21 regulations/marketing authorizations and one notice in Canada Gazette II (CGII) such as six “Food Additives” regulatory packages.
- Supported industry with pharmaceutical submissions by publishing two proposals and two notices in CGI i.e. Regulations Amending the Fees in Respect of Drugs and Medical Devices.
- Supported industry with biologic and radiopharmaceutical submissions by publishing one regulation in CGII i.e. Regulations Amending the Food and Drug Regulation (Positron-emitting Radiopharmaceuticals).
- Continued to modernize Health Canada's regulatory frameworks through ongoing review and updating of the Department's complement of regulations to effectively align regulatory tools with changing needs. For example, Health Canada published the New Classes of Practitioners Regulations under the Controlled Drugs and Substances Act in November 2012. These regulations aim to increase flexibility within the health care system and improve the timelines of service delivery in Canada.
Advanced five projects as part of the Canada-US Regulatory Cooperation Council (RCC) initiative aimed at reducing regulatory burden and supporting co-operation with the United States. These projects were:
- Electronic submission gateway to allow industry applicants to submit health product submissions electronically to both Health Canada and the U.S. Food and Drug Administration (FDA).
- Over-the-Counter Therapeutic Products Pilot project to develop aligned monograph elements for a selected over-the-counter (OTC) drugs.
- Good manufacturing practices - to enhance collaboration on enforcement and compliance by increasingly sharing routine surveillance of good manufacturing practices inspection reports of manufacturing facilities for drugs and personal products.
- A parallel submission review project with the FDA in the area of veterinary drugs to help facilitate simultaneous availability of these products.
- Classification and labelling of chemicals (workplace hazards) to align and synchronize implementation of common classification and labelling requirements for workplace hazardous chemicals within the mandate of the U.S. Occupational Safety and Health Administration and Health Canada.
- The department hosted a joint Canada-US Stakeholder Consultation in October 2012 to seek feedback on the implementation of the Crop Protection Products Initiative co-led by the Pest Management Regulatory Agency and the U.S. Environmental Protection Agency (EPA).
- The RCC Joint Action Plan also included a proposal to share information and develop joint Canada-U.S. approaches on regulatory aspects of nanomaterials. This includes developing consistent approaches to the risk assessment and management of nanomaterials, as well as sharing scientific and regulatory expertise.
Communicated clearly with citizens, the private sector and other partners to support an effective and transparent regulatory system for health protection. Piloted a Patient and Consumer Participation Pool to seek the views of a wider variety of patients and consumers, drawing on tools designed to enhance public understanding of the regulatory process.
Priority III - Strengthen First Nations and Inuit Health Programming
Type : Ongoing
Strategic Outcome(s): 3
Why is this a priority?: Health Canada plays an important role in supporting the delivery of, and access to, health programs and services for First Nations and Inuit. The department works with partners on innovative approaches to strengthen access, improve integration of health services, and encourages greater control of health care delivery by First Nations and Inuit. Many departmental strategies have evolved to correspond to the health needs of First Nations and Inuit. In addition, Health Canada worked with partners to develop a Strategic Plan for the department's First Nations and Inuit Health Branch (FNIHB), which is intended to provide a stronger sense of coherence and direction for activities, and demonstrate how they contribute to improve health outcomes for First Nations and Inuit.
Summary of Progress:
- Worked to strengthen the provision of primary health care services to First Nations and Inuit communities by developing new models of service delivery in remote and isolated communities and using funds from the Aboriginal Health Human Resources Initiative to support a strong health human resources structure.
- Continued to collaborate with provinces, territories and First Nations and Inuit communities to ensure quality service delivery, and implement the British Columbia Tripartite Framework Agreement on First Nations Health Governance.
- Worked to improve the quality and availability of comprehensive mental health and addictions services. Funded a total of 136 community-based suicide prevention projects for at-risk First Nations and Inuit communities; supported a network of 47 First Nations addiction treatment centres; and implemented a total of 25 drug utilization prevention and promotion projects in 21 communities in Ontario, Alberta and Atlantic regions.
- Collaborated with Aboriginal Affairs and Northern Development Canada and other key partners to develop approaches in areas of mutual interest for advancing First Nations and Inuit health, to guide health survey research and analysis, and to harmonize or improve the practices and systems that departments use to manage contribution agreements.
- To support sustainable delivery of Non-Insured Health Benefits to eligible First Nations and Inuit, Health Canada took concrete steps to increase efficiency and reduce administrative costs; enhance enforcement on benefits coordination; expand its short term dispensing policy to restrict the maximum frequency for reimbursing dispensing fees for a specified list of drugs, and implement a fraud detection software system for pharmacy benefits.
Since its release, the FNIHB Strategic Plan has provided a greater level of cohesion for the Branch's multiple business lines by clearly setting the principles and strategic goals and objectives, by which we undertake the various aspects of our mandate. Furthermore, the Strategic Plan's key objectives inform priorities which enable the Branch to develop a more integrated approach to planning, monitoring and reporting.
Priority IV - Align resources to priorities in a way that is flexible and forward-looking
Type : Ongoing
Strategic Outcome(s): 1, 2, 3 and Internal Services
Why is this a priority?: The Government has committed to working to increase the efficiency of operations in all departments and agencies while maintaining frontline services to Canadians. Given an extensive range of legislated responsibilities, an active policy and program agenda and the need for significant investments in the infrastructure to support core departmental operations and programming, Health Canada is committed to identifying efficiencies and reallocating resources to deliver the best results possible and provide value for money.
Summary of Progress:
- Provided strategic, organizational design and classification support for transformative initiatives such as the creation of the new Shared Services Portfolio Partnership while respecting the terms of the joint labour management Workforce Adjustment Directive.
- Continued to use its strategic investment planning process to prioritize department-wide projects that best support Government of Canada objectives and reflect the areas of greatest risk for Health Canada. Implemented monthly risk management reporting on the delivery of approved IT investment plan priorities.
Priority V - Improve Management Supports for Effective Program Delivery
Type : Ongoing
Strategic Outcome(s): 1, 2, 3 and Internal Services
Why is this a priority?: Service in Health Canada takes many forms, - from ensuring access by Canadians to high-quality departmental programs and services - to effective internal operations to deliver results for Canadians based on value for money. The department is committed to focusing improvements to service delivery in support of core programs, and establishing and tracking the accountability mechanisms necessary for service improvement.
Summary of Progress:
- Developed, implemented and monitored service standards to support more efficient departmental operations in the areas of Human Resources, mail, IT infrastructure, laboratory commodities and procurement.
- Developed a three-year IM/IT strategic plan that articulates the key investments needed to manage costs better while supporting priorities such as regulatory modernization, and a single departmental grants and contributions system.
Priority VI - Increase transparency and innovative communications and engagement with Canadians
Type : Ongoing
Strategic Outcome(s): 1, 2, 3 and Internal Services
Why is this a priority?: Canadians have rising expectations in terms of their ability to influence government choices and their ability to gain easy access to the information they need to lead healthier lives. Health Canada is committed to engaging Canadians to ensure that its policies, programs and services reflect citizen priorities and perspectives, and to using the internet and new technological tools to make information easily accessible.
Summary of Progress:
- Informed Canadians, via social marketing campaigns, about information which can help them make healthier and safer choices. For example, the Canadian Health and Safety Campaign increased awareness about a new GOC web database that contains recalls and safety alerts for food, consumer products, vehicles and health products, all in one location. In the last quarter, the related mobile application has been downloaded more than 34,000 times.
- Established innovative partnerships with the private sector, to extend the reach and impact of messaging. Nearing the completion of year three, Health Canada's Nutrition Facts Education Campaign continued to build momentum through its innovative partnership approach. At the core of this campaign is the collaboration with the Food and Consumer Products of Canada (FCPC) which extends the reach of the campaign messages. Participating members include 34 food manufacturers, such as Kraft, Nestle, McCain and Post, as well as McDonalds.
- Used social media tools (YouTube, Facebook, and Twitter) to engage with Canadians on key health and safety issues.
- Maintained a high quality web presence while renewing the web to fully meet Treasury Board Secretariat's Phase 2 Web Standard on Accessibility. Launched a Canadian Health and Safety campaign to promote the Healthy Canadians web site and the Recalls and Safety Alerts web application. Increased web visits by over 800% and number of Healthy Canadian Facebook fans by more than 150%.
- Contributed to improving openness and transparency of communications and consultation practices, including establishing a listserv to notify interested Canadians of upcoming consultations.
Risk Analysis
Strategic context and operating environment
Operating in a dynamic and complex environment, Health Canada requires the capacity to recognize, understand, accommodate and capitalize on emerging opportunities and address possible threats. Below is an overview of Health Canada's external operating environment and the major risk drivers in 2012-13.
Health care continued to be a topic of national importance to Canadians. As well informed consumers, Canadians continued to expect that the products they use and the foods and drugs they consume are safe. Similarly Canadians are well informed about health issues such as mental illness, obesity and health care. In this context, Canadians were satisfied with the department's communication of issues associated with health and consumer product safety.
Technological innovation continued to evolve rapidly and Health Canada and its employees made efforts to keep pace with these changes. New employees entered the workforce expecting a fully connected workplace. This presented opportunities and challenges in the recruitment and retention of new entrants into the public service. Canadians expected to communicate with Health Canada and receive up-to-date health information through the internet and other social media. Health Canada responded to and continues to explore ways to meet these needs.
A slow global economic recovery and increased global competition from emerging markets created uncertainty for the Canadian economy. Given that in this economic context, key industry stakeholders needed certainty over the time required to process drug and consumer product approvals, Health Canada continued to focus on the efficient processing of regulatory approvals.
Many Canadians also expect to be protected from potential health effects of exposure to environmental contaminants; notably, one third of the general public indicated air pollution or smog as the most significant environmental health hazard. As such Health Canada assessed risks and implemented appropriate responses to environmental hazards.
The following table describes the key risks identified by Health Canada in 2012-13 and examples of how the department responded to those risks.
| Risk | Risk Response Strategy | Link to PAA | Link to Priority |
|---|---|---|---|
A. Health and Environment: Health Canada regulates products that could adversely impact Health and Environment |
|
2.7 |
II |
|
2.3 |
||
|
2.3 |
||
B. Human Resources: Canada has a competitive labour market for highly-specialized health talent |
|
3.3 |
V |
|
IS 3.1 |
||
|
IS 3.1 |
||
C. Legislation and Regulation: Health Canada's legislated and regulatory responsibilities are challenging given the increasing globalized and innovative health and food product marketplace that exists, featuring many new products |
|
1.1 |
II |
|
2.4 |
||
|
2.4 |
||
D. Financial: The department faces ongoing financial risks because much of its business is demand-driven, which limits the certainty in budget planning |
|
3.2 |
III |
|
2.1 |
II |
Risk Analysis Narrative:
A. Health and Environment: Health Canada regulates products that could adversely impact Health and Environment
Health Canada regulates a wide range of products ranging from cosmetics to pesticides.
The department must weigh the costs and benefits of these products before and after they enter the market to prevent adverse risks to the health of Canadians and the environment. For example, the department improved pesticide safety through marketplace inspections and increased surveillance of unregistered international consumer pesticides. To deal with risks associated with reporting compliance rates for high-risk violators, Health Canada streamlined processes and increased international collaboration. Lessons learned included an appreciation of the benefits of streamlining and international collaboration. As well, knowledge transfer and experience were identified as important factors for the successful implementation of best practices across Pesticide Safety Program activities.
The Chemicals Management Plan remained a key priority for the Department in 2012-13. Good progress was made towards the goal of addressing 1,500 remaining priority existing substances between 2011 and 2016. By the end of 2012-13, approximately 18% of the goal had been reached, which is largely consisted with where the program had expected to be at this stage. Some key lessons learned through delivery on priorities involved appreciating the need to communicate progress periodically to stakeholder in a meaningful way. It is important as well to reconsider approaches to early stakeholder engagement and to understand that different stakeholders engage/take proactive action at different stages of the CMP cycle.
Undertaking a large, multi-site study on the effects of chemical, such as the Maternal-Infant Research on Environmental Chemicals (MIREC) Research Platform revealed the challenges associated with following the participants over time to assess potential health effects of early-life exposure to chemicals. Also identified was the need for investments in information management and technology to allow database and analytics work to be undertaken.
Collaboration with all levels of government, industry, health professionals, organizations and the general public continued to be essential in developing a national framework to manage air quality and in expanding the Air Quality Health Index (AQHI), a web-based outreach tool to help Canadians manage their daily exposure to air pollutants. Similarly, participation of all levels of government and the general public were critical to enhancing community resiliency to extreme heat via the development of heat alerts and response systems as well as the provision of technical advice to public health and health professionals.
Health Canada completed several projects to address risks associated with water quality including publication in August 2012 of updated Guidelines for Canadian Drinking Water Quality developed in collaboration with the Federal-Provincial-Territorial Committee on Drinking Water. The Department also contributed to the Canadian Environmental Sustainability Indicators (CESI) project of the Federal Sustainable Development Strategy, to permit better analysis of hazards to water quality.
B. Human Resources: Canada has a competitive labour market, particularly for highly-specialized health talent
Health Canada's competes for access to a limited pool of experienced and skilled professionals - particularly among nurses, biotechnologists, toxicologists and environmental health officers - and uses various strategies and approaches to maintain the capabilities required to deliver on its mandate. The department concurrently developed necessary human resources (HR) infrastructure to implement transformative initiatives such as the portfolio shared services partnership while maintaining frontline services and respecting the terms of the joint labour-management workforce adjustment directive.
Recruitment and retention of nurses for remote on-reserve nursing stations remained a challenge. Difficulties related to the conditions of nurses working in remote and isolated communities required a multi-faceted approach, such as the continued implementation of the Nursing Innovation Strategy 2008-2013 (NIS). NIS education investments have increased the number of nurses prepared with remote practice competencies through access to new education programs and on-line education and training programs, including the Regional Nursing Education Activities and the National/Regional Education Project Pilots.
The department created the Regional Nurse Resource Teams, allowing nurses to remain part-time with the department, thus increasing the ability to staff remote nursing stations. However, absorbing administrative burdens stemming from the implementation of the Regional Nurse Resource Teams was a challenge. Nonetheless, based on lessons learned, the team model is being implemented in a number of communities and is expected to positively impact recruitment and retention.
Health Canada used various programs to develop and retain scientific talent and encourage cross-cutting assignments within the department namely, the Science Management Development Program; the Scientist Development Program; and the Health Canada Assignment Program.
Lessons learned from these initiatives are being noted, such as the need for more emphasis on marketing of programs. For example, better marketing could have increased participation in the Federal Internship Newcomers Initiative; a program meant to provide hiring managers with highly qualified expertise to assist with short term projects or capacity requirements.
C. Legislation and Regulation: Health Canada's legislated and regulatory responsibilities are challenging given the increasing globalized and innovative health and food product marketplace that exists, featuring many new products
To address new and emerging issues in the global, innovative health and food marketplace, Health Canada supported the modernization of Canada's legislative frameworks and collaborated with international counterparts. In 2012-13, the department implemented Year 3 of a pilot project for the Use of Foreign Regulatory Information (UFRI), and developed an evaluation plan and standard operating procedures for reviewers. Several components of the UFRI moved ahead despite challenges in the availability of expertise. Its scope was expanded on the web to increase interest. Health Canada received accreditation for its biologics drug product laboratories to facilitate greater international collaboration for safety assessments of biologicals via leveraging of international laboratory evaluations.
To address regulatory burdens on industry, Health Canada continued its work to harmonize regulatory activities with international partners. In conjunction with the United States (US) Federal Drug Administration's Center for Veterinary Medicine, it completed the first review and approval of a veterinary drug application resulting in near simultaneous market access, under an initiative of the Canada-United States Regulatory Cooperation Council (RCC). A Memorandum of Understanding (MoU) was signed in July 2012 with the Official Medicines Control Laboratories of the European Directorate for the Quality of Medicines. This enabled the exchange of decision-making information on the quality assessment of vaccines and blood products for lot release. In collaboration with international partners and other federal agencies, the department developed tools and methods for improved influenza vaccine quality testing, production and shelf-life. Health Canada also collaborated with international partners to develop a novel, improved method for testing the quality of varicella (chicken pox) vaccines.
Health Canada continued its implementation of the Canada Consumer Product Safety Act (CCPSA). Both the department and industry worked to adapt to new policies and operational procedures to address their responsibilities set out in the new Act, and the increased number and broader scope of industries covered by the CCPSA. The Department is developing key policy frameworks and processes to inform decision-making and enable Consumer Product Safety program to deliver on its mandate in a transparent and effective manner.
Health Canada moved forward with the implementation of the Globally Harmonized System of Classification and Labeling of Chemicals (GHS) in Canada. A MoU was signed with the US to coordinate efforts and cooperate on GHS implementation. Working with partners (e.g. provinces and territories) and stakeholders (e.g. industry and workers) was critical in implementing the GHS under the RCC timelines.
Access to review reports from the US under the regulatory cooperation initiatives is not comprehensive but continues to improve. The increased number of vaccines in immunization programs resulted in increased workloads in lot release and review areas. Vaccine quality issues with several manufacturers have led to supply challenges and increased efforts on behalf of Health Canada to meet the demand of Canadians for safe and effective vaccines. Lessons learned include the review of expert and evidence based policies and work procedures, and the development of key policy frameworks to inform decision-making using process mapping.
D. Financial: The department faces ongoing financial risks because much of its business is demand-driven, which limits the certainty in budget planning
Health Canada's financial capacity could be strained by unforeseen changes in the operational environment which can create pressures and lapses requiring reallocations to maintain critical programs and services.
The Non-Insured Health Benefits (NIHB) program expenditures fluctuate from year to year depending on a variety of factors beyond program control (e.g., drug pricing, population increases and demand for health services). Rigorous monitoring of expenditures was undertaken, as well as the development of a cost management strategy which includes cost mitigation actions which will be implemented to ensure that expenditures remain sustainable. These measures also take into consideration the health needs of First Nations and Inuit. Enhancement of expenditure monitoring and trend analysis has proven invaluable in determining whether additional cost management actions should be taken in-year in order to manage costs and optimize NIHB expenditures.
Health Canada monitored the performance of health product cost-recovered activities to ensure standards were met, as part of the Cost Recovery Initiative. The department performance and status was through departmental and branch dashboards, allowing it to adjust plans when necessary. An outdated user fee regime prior to 2011 led to backlogs, particularly in the area of generics. It has taken some time and significant effort to reduce this backlog. A key lesson learned is that it takes time to put systems, policies and people in place to help ensure that the department is well placed to meet service standards.
Summary of Performance
| Total Budgetary Expenditures (Main Estimates) 2012-13 |
Planned Spending 2012-13 |
Total Authorities (available for use) 2012-13 |
Actual Spending (authorities used) 2012-13 |
Difference (Planned vs. Actual Spending) |
|---|---|---|---|---|
| 3,347.8 | 3,364.4 | 3,983.2 | 3,821.2 | -456.8 |
Notes: The increase of $618.8M between planned spending and total authorities is mainly due to the receipt of in-year funding in Supplementary Estimates and from the department's operating and capital budget carry forwards that was allocated to fund strategic investments in IM/IT and Real Property. The total authorities were also supplemented by payments required by collective agreements. The $162M difference between total authorities and actual spending is the result of a lower than projected demand for Non-Insured Health Benefits (NIHB), implementation of Economic Action Plan 2012 initiatives and includes a portion of the operating budget that was carried forward to support strategic investments in 2013-14.
| Planned 2012-13 |
Actual 2012-13 |
Difference 2012-13 |
|---|---|---|
| 10,073 | 9,532 | 541 |
Notes: The majority of the variance between planned and actual FTEs is the result of savings achieved through the simplifying and streamlining operations in accordance with Economic Action Plan 2012 while maintaining or enhancing services to Canadians. Most reductions in FTEs were achieved through attrition and voluntary departures.
Strategic Outcome 1: A Health System Responsive to the Needs of Canadians
| Program | Total Budgetary Expenditures (Main Estimates 2012-13) | Planned Spending | Total Authorities (available for use) 2012-13 | Actual Spending (authorities used) |
Alignment to Government of Canada Outcomes | ||||
|---|---|---|---|---|---|---|---|---|---|
| 2012-13 | 2013-14 | 2014-15 | 2012-13 | 2011-12 | 2010-11 | ||||
| Canadian Health System | 299.5 | 310.5 | 296.2 | 244.6 | 424.2 | 405.7 | 371.3 | 377.5 | Healthy Canadians |
| Specialized Health Services | 21.7 | 21.7 | 21.9 | 22.6 | 24.3 | 19.9 | 22.3 | - | |
| Official Language Minority Community Development | 39.9 | 39.9 | 23.8 | 23.8 | 39.9 | 39.0 | 39.0 | - | |
| Canadian Assisted Human Reproduction | - | - | - | - | - | - | - | 3.4 | |
| International Health Affairs | - | - | - | - | - | - | - | 18.7 | |
| Workplace Health | - | - | - | - | - | - | - | 31.7 | |
| Strategic Outcome 1 Sub-Total |
361.1 | 372.1 | 341.9 | 291.0 | 488.4 | 464.6 | 432.6 | 431.3 | |
Strategic Outcome 2: Canadians are informed of and protected from health risks associated with food, products, substances and environments, and are informed of the benefits of healthy eating
| Program | Total Budgetary Expenditures (Main Estimates 2012-13) | Planned Spending | Total Authorities (available for use) 2012-13 | Actual Spending (authorities used) |
Alignment to Government of Canada Outcomes | ||||
|---|---|---|---|---|---|---|---|---|---|
| 2012-13 | 2013-14 | 2014-15 | 2012-13 | 2011-12 | 2010-11 | ||||
| Health Products | 158.9 | 158.9 | 156.8 | 145.8 | 164.7 | 164.7 | 177.2 | 170.6 | Healthy Canadians |
| Food Safety and Nutrition | 52.6 | 53.1 | 54.2 | 54.0 | 69.8 | 69.7 | 67.9 | 58.4 | |
| Sustainable Environmental Health | - | - | - | - | - | - | - | 134.9 | |
| Environmental Risk to Health | 115.4 | 115.4 | 109.8 | 106.1 | 117.6 | 103.7 | 105.1 | - | |
| Consumer Products Safety | 33.4 | 33.4 | 31.4 | 31.4 | 29.8 | 28.1 | 27.7 | 27.9 | |
| Substance Use and Abuse | 131.0 | 131.0 | 85.7 | 80.2 | 124.0 | 115.5 | 123.0 | 124.0 | |
| Radiation Protection | 7.4 | 7.4 | 15.7 | 15.5 | 15.4 | 15.3 | 14.0 | - | |
| Pesticides Safety | 39.0 | 39.0 | 41.2 | 40.3 | 45.1 | 42.1 | 46.8 | 46.3 | |
| Strategic Outcome 2 Sub-Total |
537.7 | 538.2 | 494.7 | 473.2 | 566.4 | 539.1 | 561.7 | 562.1 | |
Strategic Outcome 3: First Nations and Inuit communities and individuals receive health services and benefits that are responsive to their needs so as to improve their health status
| Program | Total Budgetary Expenditures (Main Estimates 2012-13) | Planned Spending | Total Authorities (available for use) 2012-13 | Actual Spending (authorities used) |
Alignment to Government of Canada Outcomes | ||||
|---|---|---|---|---|---|---|---|---|---|
| 2012-13 | 2013-14 | 2014-15 | 2012-13 | 2011-12 | 2010-11 | ||||
| First Nations and Inuit Primary Health Care | 891.7 | 891.7 | 954.1 | 940.8 | 955.3 | 981.0 | 949.1 | - | Healthy Canadians |
| Supplementary Health Benefits for First Nations and Inuit | 1,006.9 | 1,006.9 | 1,017.3 | 1,040.7 | 1,190.0 | 1,155.6 | 1,111.5 | - | |
| Health Infrastructure Support for First Nations and Inuit | 272.1 | 272.1 | 231.6 | 233.6 | 356.7 | 305.9 | 351.6 | - | |
| First Nations and Inuit Health Programming and Services | - | - | - | - | - | - | - | 2,402.1 | |
| Strategic Outcome 3 Sub-Total |
2,170.7 | 2,170.7 | 2,203.0 | 2,215.1 | 2,502.0 | 2,442.5 | 2,412.2 | 2,402.1 | |
Internal Services
| Program | Total Budgetary Expenditures (Main Estimates 2012-13) |
Planned Spending | Total Authorities (available for use) 2012-13 | Actual Spending (authorities used) |
||||
|---|---|---|---|---|---|---|---|---|
| 2012-13 | 2013-14 | 2014-15 | 2012-13 | 2011-12 | 2010-11 | |||
| Internal Services | 278.2 | 283.4 | 261.6 | 242.9 | 426.5 | 374.9 | 379.8 | 357.1 |
| Total | 278.2 | 283.4 | 261.6 | 242.9 | 426.5 | 374.9 | 379.8 | 357.1 |
Performance Summary
| Strategic Outcomes and Internal Services | Total Budgetary Expenditures (Main Estimates 2012-13) | Planned Spending | Total Authorities (available for use) 2012-13 | Actual Spending (authorities used) |
Alignment to Government of Canada Outcomes | ||||
|---|---|---|---|---|---|---|---|---|---|
| 2012-13 | 2013-14 | 2014-15 | 2012-13 | 2011-12 | 2010-11 | ||||
| 3,347.8 | 3,364.4 | 3,301.2 | 3,222.2 | 3,983.2 | 3,821.2 | 3,786.3 | 3,752.6 | Healthy Canadians | |
| Total | 3,347.8 | 3,364.4 | 3,301.1 | 3,222.2 | 3,983.2 | 3,821.2 | 3,786.3 | 3,752.6 | |
Notes: Total may not add due to rounding
Narrative
Some programs only show 2010-11 Actual Spending since the department's PAA structure changed in 2011-12. These programs have now become part of other programs in Health Canada's Program Alignment Architecture.
At the outset of the 2012-13 fiscal year Health Canada's planned spending was $3,364.4 million. Through Main Estimates and Supplementary Estimates, Health Canada was allocated total authorities of $3,983.2 million. Actual Health Canada spending was $3,821.2 million.
The $16.6 million increase from Main Estimates to planned spending is mainly due to funding for the Brain Canada Research Foundation.
The $618.8 million increase from planned spending to total authorities is mainly due to incremental funding to maintain and improve Canadians' health through the provision of supplementary health benefits to eligible First Nations and Inuit; for mental and emotional support services, and for the administration and research required to support the federal government's obligations under the Indian Residential Schools Settlement Agreement; to maintain primary care nursing services in remote and isolated First Nations communities; and to continue to support the implementation of the First Nations Water and Wastewater Action Plan.
The $162.0 million difference between total authorities and actual spending is mainly the result of Non-Insured Health Benefits (NIHB) expenditures being lower due to lesser than expected client uptake by new eligible client populations (i.e. those registered under the provisions of the Gender Equity in Indian Registration Act, or those who became eligible for NIHB as a result of the creation of the Qalipu Mi'kmaq Band); policy changes related to generic pricing in the NIHB program; implementation of the Treasury Board Directive on the Management of Expenditures on Travel, Hospitality and Conferences; and phasing in of Economic Action Plan 2012 initiatives. Health Canada responded by making adjustments to its multi-year investment plan to absorb operating budget carry forwards to fund investments in 2013-14.
Expenditure Profile
For the fiscal year 2012-13, Health Canada spent $3,821.2 million to meet expected program activity results and contribute to the achievement of departmental strategic outcomes. The figure below illustrates Health Canada's spending trend from 2009-10 to 2012-13.
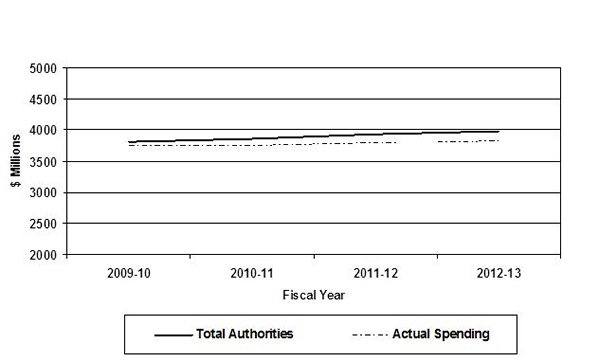
For the 2009-10 to 2012-13 periods, the total authorities include all Parliamentary appropriation sources: Main Estimates, Supplementary Estimates, and funding from various Treasury Board Votes.
As shown in the table above, Health Canada's total authorities and actual spending have increased slightly over the past four years. This upward trend reflects the increase in program funding received for priorities identified in Budget announcements for collective agreements and allowances, the incremental funding for Indian Envelope Growth, the cost recovery initiative, and for statutory authorities to make disbursements to Canada Health Infoway Inc. The increase in funding and in expenditures for 2012-13 is net of ongoing internal efficiencies.
Estimates by Vote
For information on Health Canada's organizational Votes and/or statutory expenditures, please see the Public Accounts of Canada 2013 (Volume II). An electronic version of the Public Accounts 2013 is available on the Public Works and Government Services Canada's website.
Contribution to the Federal Sustainable Development Strategy (FSDS)
The Federal Sustainable Development Strategy (FSDS) outlines the Government of Canada's commitment to improving the transparency of environmental decision-making by articulating its key strategic environmental goals and targets. Consideration of these outcomes is an integral part of Health Canada's decision-making process. Health Canada contributes to the following 2010-2013 FSDS themes as denoted by the visual identifiers and associated programs below:
- 2.3 Environmental Risks to Health
- 2.6 Radiation Protection
- 3.1 First Nations and Inuit Primary Health Care
- 2.3 Environmental Risks to Health
- 3.1 First Nations and Inuit Primary Health Care
Internal Services
Health Canada has developed an integrated system to support departmental compliance with the Cabinet Directive on Environmental Assessment of Policy, Plan and Program Proposals(Cabinet Directive).The Cabinet Directive requires that Strategic Environmental Assessments (SEAs) be conducted for proposals seeking Cabinet approval in order to identify the scope and nature of any likely environmental effects. The Cabinet Directive's guidelines also require consideration of a proposal's impact, positive or negative, on FSDS goals and targets. For all Health Canada-led proposals seeking Cabinet approval, the department was in compliance with the Cabinet Directive.
For additional details on Health Canada's activities to support sustainable development and SEA, please see Section II of the DPR and the Departmental Sustainable Development Strategy Performance Report. For complete details on the FSDS please see the Sustainable Development section of the Environment Canada website.
Section II: Analysis of Programs and Sub-Programs by Strategic Outcomes
Strategic Outcome 1: A Health System Responsive to the Needs of Canadians
Canadians expect their governments to provide a health system that meets their needs and that delivers results effectively and efficiently. In addition to ensuring that it meets specific federal responsibilities, such as health services for federal employees and during international events held in Canada, Health Canada works with provincial and territorial governments as well as health organizations and other stakeholder groups to address the health objectives of Canadians. Research and policy analysis, support and funding to test innovations in health service delivery and monitoring of provincial and territorial application of the Canada Health Act all lead to continuing improvement in Canada's health system.
Program 1.1: Canadian Health System
Sub-Programs:
- 1.1.1: Health System Priorities
- 1.1.2: Canada Health Act Administration
- 1.1.3: Emergency Health Issues
- 1.1.4: International Health Partnerships
Program 1.2: Specialized Health Services
Sub-Programs:
- 1.2.1: Public Service Occupational Health and Safety
- 1.2.2: Emergency Management
Program 1.3: Official Language Minority Community Development
Program 1.1: Canadian Health System
The goal of this Program Activity is to provide strategic policy advice, research and analysis, and program support to provinces and territories, partners and stakeholders on health care system issues. Mindful of long-term equity, sustainability and affordability considerations, Health Canada collaborates and targets its efforts with provinces and territories, national and international organizations, health care providers, professional associations, other key stakeholders and Canadians in order to support improvements to the health care system, such as improved access, quality and integration of health care services. These targeted efforts are in place to better meet the health needs of Canadians, wherever they live or whatever their financial circumstances. Focusing on emerging health issues enables Health Canada to strategically position itself as a proactive organization, and targeted Grants and Contributions funding to support our health partners helps to ensure Health Canada is an active player in tackling domestic and global health issues.
| Total Budgetary Expenditures (Main Estimates) 2012-13 |
Planned Spending 2012-13 | Total Authorities (available for use) 2012-13 | Actual Spending (authorities used) 2012-13 | Difference 2012-13 |
|---|---|---|---|---|
| 299.5 | 310.5 | 424.2 | 405.7 | -95.2 |
Notes: The increase of $113.7M from planned spending to total authorities is mainly due to funding received to promote and support health system innovation, which will improve the effectiveness, efficiency and accountability of the system. The variance of $18.5M between total authorities and actual spending is a result of timing and implementation challenges.
| Planned 2012-13 |
Actual 2012-13 |
Difference 2012-13 |
|---|---|---|
| 321 | 155 | 166 |
Notes: The variance between planned and actual FTE utilization is mainly due to a reduction in staff as a result of savings achieved through simplifying and streamlining operations and the transfer of various programs to the Public Health Agency of Canada including responsibility for services related to emergency management and international affairs as part of the Health Portfolio Shared Services Partnership. Most reductions in FTEs were achieved through attrition and voluntary departures.
| Expected Results | Performance Indicators | Targets | Actual Results |
|---|---|---|---|
| 1. Acts as a catalyst to address current and emerging health issues and priorities. | Actions taken to respond to current and emergent issues by:
|
Increased adoption of new approaches, models and best practices in health care system. | Engaged in discussions with Canadian Blood Services and provincial and territorial governments to identify priorities for national organ and tissue donation and transplantation activities. Supported a community-integrated palliative care initiative by the Canadian Hospice Palliative Care Association to broaden access to palliative care in a range of settings and by a variety of providers so that these services are supplied in a cost- effective and sustainable way. All provinces and territories have been consulted on core concepts, with ten actively engaged to date. Five provinces and territories are engaged in the Home Care Policy Lens. |
Performance Analysis and Lessons Learned
Health Canada contributed to advancing health system performance reporting. In June 2012, the Government announced $238.7 million over three years for the Canadian Institute for Health Information to continue working with provinces and territories to fill data gaps and produce timely, meaningful, and comparable information. As a result of such collaborative partnerships, Canada has a strong foundation on which to build a pan-Canadian framework for comparable measurement and reporting that supports system innovation and improvement.
Health Canada supported 21 projects to improve health human resources planning and forecasting; create healthy, supportive, learning work places; use human resources skills effectively; and increase the number of health care providers. Some examples are:
- The National Nursing Quality Report initiative was launched. Health Canada supported the development of national nursing quality indicators that will contribute towards timely and informed decisions about the organization and delivery of patient care for improved outcomes.
- Phase I of the Nature of Nursing Practice in Rural and Remote Canada study (2010/11 - 2014/15) was completed. This study will provide a clearer picture on the changing roles of health care professionals who provide services in rural and remote communities. Findings will inform policy development on the practice, recruitment, retention and education of nurses in rural and remote Canada.
- The Family Medicine Residencies Initiative provides up to $39.5 million in funding over six years to the provinces and territories for the creation of more than 100 training positions in rural and remote communities across the country. For example, in Manitoba, 15 family medicine residents completed their training in underserved rural and remote communities.
Health Canada's funding of the Internationally Educated Health Professionals Initiative (IEHPI) advanced workforce integration of internationally-educated health professionals, through approximately 28 projects across all provinces and territories and four funding agreements with pan-Canadian organizations. IEHPI funding supported the development of a common tool to assess an international medical graduate's preparedness for entry into post-graduate training. In 2012, a total of 931 foreign-trained health professionals completed this entry-to-residency assessment.
Health Canada provided policy leadership and guidance to intergovernmental working groups focused on nine health related occupations targeted as Foreign Qualification Recognition (FQR) priorities. Health Canada's leadership helped medical regulators, assessment programs, faculties of medicine and other heath stakeholders to agree on an action plan for physicians, a health occupation identified as a priority for FQR implementation.
Sub-Program Reporting 1.1.1 Health System Priorities
Sub-Program Description
This sub-activity provides policy leadership for health system priorities that benefit Canadians through improved access to quality health care services. Through policy and program activities, Health Canada works closely with provincial and territorial governments, health care providers and other stakeholders to develop and implement innovative approaches and responses to meet the health priorities and needs of Canadians such as increasing the supply of health professionals, timely access to quality health care services, and accelerating the development and implementation of electronic health technologies. This also includes Grants and Contributions to enhance the breadth and scope of research on women's health issues as well as promoting gender as a critical variable in health. Federal investments in national shared-governance entities and targeted federal programs have laid a solid foundation for progress on a number of significant issues, including health information (Canadian Institute for Health Information), accountability (Health Council of Canada), cost-effectiveness of drugs (Canadian Agency for Drugs and Technologies in Health), patient safety (Canadian Patient Safety Institute), cancer (Canadian Partnership Against Cancer), and mental health (Mental Health Commission of Canada).
| Planned Spending 2012-13 |
Actual Spending 2012-13 |
Difference 2012-13 |
|---|---|---|
| 252.7 | 389.3 | -136.6 |
Notes: The variance between planned and actual spending is due to the statutory grant funding received for Canada Health Infoway to foster and accelerate the development and adoption of electronic health information communication technologies.
| Planned 2012-13 |
Actual 2012-13 |
Difference 2012-13 |
|---|---|---|
| 252 | 129 | 123 |
Notes: The variance between planned and actual FTE utilization is mainly due to a reduction in staff as a result of savings achieved through simplifying and streamlining operations to focus on a more targeted agenda related to health care policy and programs. Most reductions in FTEs were achieved through attrition and voluntary departures.
| Expected Results | Performance Indicators | Targets | Actual Results |
|---|---|---|---|
| 1. Improved policies or practices to advance health system priorities. | # of policies or practices to advance health system priorities by:
|
Target: Increased number of policies and practices that address health system priorities. | Health Canada supported Canadian Blood Services to continue collaborative work with provincial/territorial (P/T) officials to identify specific roles, functions and priority areas to further a nationally coordinated organ and tissue donation and transplantation (OTDT) system. Health Canada supported a community-integrated palliative care initiative by the Canadian Hospice Palliative Care Association to broaden the range of settings and variety of providers to increase cost-effective and sustainable palliative services. Health Canada supported the Canadian Home Care Association to create and disseminate a Home Care Policy Lens to support collaboration across health sectors and optimize home care services by providing guidance for planning and evaluation to policy makers across the country. Five provinces and territories were engaged in testing the Home Care Policy Lens. Health Canada supported the Mental Health Commission of Canada in its development of Changing Directions, Changing Lives, Canada's first comprehensive national mental health strategy released in May 2012. The Commission also continued its work on the At Home/Chez Soi project, contributing to the body of research on the benefits of “housing first” housing support models for homeless persons living with mental health issues. |
| 2. Improved and maintained strategic partnership with key national/P/T/ regional partners (e.g. , through funding such as Grants & Contributions) to advance health system priorities. | # and type of new/maintained and/or improved collaborative working arrangements and/or agreements between Government of Canada, P/Ts and stakeholders to advance health system renewal by:
|
Target: Maintained strategic partnership with key national/P/T/ regional partners to advance health system priorities. | 21 contribution agreements through the Health Human Resource Strategy. 7 agreements with P/Ts and 14 agreements with national stakeholders and Canadian academic organizations. All provinces and territories have been consulted on core concepts for the Framework for community-integrated palliative care, with ten actively engaged to date. 5 P/Ts engaged in testing the Home Care Policy Lens. Through IEHPI, 10 funding agreements representing all 13 P/Ts, and 4 funding agreements with pan-Canadian organizations are in place. Strengthened collaborations with the Canadian Patient Safety Institute; the Canadian Foundation for Healthcare Improvement; the OECD Health Committee; the Health Council of Canada; the Canadian Partnership Against Cancer; the Mental Health Commission of Canada; and Canada Health Infoway. Contribution agreements with the Canadian Institute for Health Information; the Canadian Blood Services - OTDT; Canadian Blood Services - Blood Research and Development; the Brain Canada Foundation; and the Mood Disorders Society of Canada. |
| 3. Information developed and disseminated in response to the needs of Canadians. | Information needs identified that meet the needs of Canadians by:
|
Target: Increased amount (#) of information developed and disseminated to Canadians. | Health Canada worked with the Canadian Institute for Health Information to improve information available to health system managers and the public, especially through its health system performance measurement and reporting initiative and the development of a national Multiple Sclerosis registry. Through the Health Care Policy Contribution Program, Health Canada supported projects such as:
Contributed to the Evidence-Informed Healthcare Renewal Portal (collaboration between the McMaster Health Forum and the Canadian Institutes of Health Research), aimed at providing single point of access to the body of evidence related to health care renewal. |
Sub-Program 1.1.1 Narrative
This sub-program met all of its expected results during the fiscal year. Health Canada worked closely with provincial and territorial governments to develop national approaches on health system issues and promoted the pan-Canadian adoption of best practices. Health Canada also provided strategic advice and targeted funding to support the federal government's health care priorities.
Health Canada administered a number of named grants and contribution programs that enhanced the evidence base for health care decision-making, promoted innovation, and supported national policy dialogue on current and emerging health system priorities. In 2012-13, Health Canada consolidated the management of these grants and contribution programs.
Evaluations conducted to date have revealed no serious concerns with respect to the effectiveness and/or efficiency of these investments.
Sub-Program Reporting 1.1.2 Canada Health Act Administration
Sub-Program Description
The administration of the Canada Health Act involves monitoring a broad range of sources to assess the compliance of provincial and territorial health insurance plans with the criteria and conditions of the Act, working in partnership with provincial and territorial governments to investigate and resolve concerns which may arise, providing policy advice and informing the Minister of possible non-compliance with the Act, recommending appropriate action when required, and reporting to Parliament on the administration of the Act.
| Planned Spending 2012-13 |
Actual Spending 2012-13 |
Difference 2012-13 |
|---|---|---|
| 2.1 | 1.9 | 0.2 |
| Planned 2012-13 |
Actual 2012-13 |
Difference 2012-13 |
|---|---|---|
| 25 | 17 | 8 |
Notes: The variance between planned and actual FTEs is mainly due to a reduction in staff as a result of savings achieved through simplifying and streamlining operations to focus a more targeted agenda related to health care policy and programs. Most reductions in FTEs were achieved through attrition and voluntary departures.
| Expected Results | Performance Indicators | Targets | Actual Results |
|---|---|---|---|
| 1. Provincial and territorial compliance with the criteria and conditions of the Canada Health Act. | Action undertaken to address non-compliance issues. | Target: No initiation of provisions of section 14(2) or section 20(1) of the Act. | There was no initiation of section 14(2) of the Act during the period April 1, 2012 to March 31, 2013. |
Sub-Program 1.1.2 Narrative
The Canada Health Act sets out the criteria, conditions and provisions that provinces and territories must meet to receive the full amount of their Canada Health Transfer payments.
There have been no fundamental changes to the content and requirements of the Act since its enactment in 1984. However, in 2012-13, the Act was amended to include members of the Royal Canadian Mounted Police (RCMP) under the definition of insured persons. When formerly excluded from the definition, their basic health insurance coverage for hospital and physician services was provided by the RCMP. As a result of this amendment, they now receive health insurance coverage from provincial and territorial health care insurance plans.
As required by section 23 of the Act, the Minister of Health tabled the 2011-12 annual report on the administration of the Act on February 14, 2013. The report provides an overview of the Act and its administration, and a description of how the 13 provincial and territorial health care insurance plans meet the requirements as well as any compliance issues.
Sub-Program Reporting 1.1.3 Emergent Health Issues
Sub-Program Description
The rapid pace of technological change and emerging technologies in the area of nanotechnology, assisted human reproduction, genetic, medicine, health and food innovation are creating challenges for the Government of Canada and internationally. These transformative technologies, global supply chains and competing expectations from a diverse population are changing the environment in which Health Canada carries out its health and safety mandate. This sub-activity identifies emergent issues, provides strategic policy advice on how best to address them and develops appropriate responses, such as policy, new legislative or regulatory frameworks, tools or other approaches. This sub-activity also focuses on developing policies and regulations in the area of assisted human reproduction (AHR). The science of AHR evolves rapidly and, as a result, the program engages stakeholders on an ongoing basis to find a balance between competing policy drivers. The goal is to develop a responsive regulatory regime which is a leader both domestically and in the international AHR community, and reflects the objectives put forward in the Assisted Human Reproduction Act.
| Planned Spending 2012-13 |
Actual Spending 2012-13 |
Difference 2012-13 |
|---|---|---|
| 6.5 | 1.5 | 5.0 |
Notes: The variance between planned and actual spending is mainly due to savings achieved through simplifying and streamlining operations to focus on a more targeted agenda related to health care policy and programs.
| Planned 2012-13 |
Actual 2012-13 |
Difference 2012-13 |
|---|---|---|
| 27 | 9 | 18 |
Notes: The variance between planned and actual FTE utilization is mainly due to a reduction in staff as a result of savings achieved through simplifying and streamlining operations to focus on a more targeted agenda related to health care policy and programs. Most reductions in FTEs were achieved through attrition and voluntary departures.
| Expected Results | Performance Indicators | Targets | Actual Results |
|---|---|---|---|
| 1. Emerging health issues are identified and addressed through strategic policy advice. | Actions taken to respond to current and emergent issues by:
|
Target: Appropriate regulations in place in response to emerging health issues. | Federal responsibilities for assisted human reproduction transferred to Health Canada from former Assisted Human Reproduction Agency of Canada |
Sub-Program 1.1.3 Narrative
In response to the 2010 ruling of the Supreme Court of Canada, Health Canada has taken over responsibility for federal functions in the area of assisted human reproduction, e.g., compliance, enforcement, and outreach.
Sub-Program Reporting 1.1.4 International Health Partnerships
Sub-Program Description
International Health Partnerships works to facilitate Health Canada's participation in international activities, strengthens intersectoral collaboration and promotes increased awareness and understanding of current and emerging global health issues of priority to Canada. Through grants, Health Canada supports selected international health organizations or health initiatives whose mandates are consistent with departmental objectives and current health policy and priorities. Other funded projects include partnering with international organizations such as the Pan American Health Organization (PAHO), the Organisation for Economic Co-operation and Development (OECD), the International Agency for Research on Cancer (IARC) and the Global Health Research Initiative (GHRI) in order to address global health issues.
| Planned Spending 2012-13 |
Actual Spending 2012-13 |
Difference 2012-13 |
|---|---|---|
| 49.2 | 13.0 | 36.2 |
Notes: The variance between planned and actual spending and FTE utilization is due to the transfer of this function and resources to the Public Health Agency of Canada as part of the Health Portfolio Shared Services Partnership. Some transfer payments were made by Health Canada in advance of the transfer of the program to the Public Health Agency of Canada on July 1, 2012.
| Planned 2012-13 |
Actual 2012-13 |
Difference 2012-13 |
|---|---|---|
| 18 | 0 | 18 |
Notes: The variance between planned and actual spending and FTE utilization is due to the transfer of this function and resources to the Public Health Agency of Canada as part of the Health Portfolio Shared Services Partnership.
| Expected Results | Performance Indicators | Targets | Actual Results |
|---|---|---|---|
| 1. Advance Canada's international health priorities through strategic partnerships. | New/sustained targeted agreements by:
|
Target: Better collaboration with governments and stakeholders to advance Canada's international health priorities. | Improved international collaboration with governments and stakeholders through payment of Canada's assessed contributions to two multilateral health organizations (Pan American Health Organization and International Agency for Research on Cancer). |
Sub-Program 1.1.4 Narrative
The International Health Grants Program continued to facilitate engagement in a number of international organizations including the Pan American Health Organization and the International Agency for Research on Cancer in order to promote collaboration and advance the Health Portfolio's international priorities.
Canada's engagement with the Pan American Health Organizations supports the Government of Canada's Americas Strategy which seeks to strengthen Canada's multilateral and bilateral relationships in the hemisphere within the health sector. In 2012, Canada provided technical assistance on health issues such as: regulation of tobacco products, health statistics, human resources for health, implementation of International Health Regulations and control of non-communicable diseases. In September 2012, Canada began a three year term on PAHO's Executive Committee providing Canada with an opportunity to advance key regional governance and health priorities.
Working in collaboration with the Canadian Institutes for Health Research, Health Canada's participation in the International Agency for Research on Cancer focused on ensuring effective governance for how resources are spent; influencing the nature, scope and objectives of research conducted by the Agency; and contributing to how information is disseminated.
Effective July 1, 2012, responsibility for this program was transferred to the Public Health Agency of Canada.
Program 1.2: Specialized Health Services
These specialized health services ensure continuity of services and occupational health services to public servants and work to ensure that Health Canada is prepared and able to continue services in the event of a national emergency. By working pro-actively to reduce the number of workdays lost to illness, Health Canada is promoting a productive public service thereby delivering results to Canadians. This program also ensures that Health Canada works internally and with partners to ensure that Health Canada has preparedness plans that are ready for execution in the event of a national emergency. Ensuring that organizations have plans in place that take into account all facets of their legislated responsibilities helps Health Canada continue to deliver services to Canadians at a time that it will be most needed. This includes coordination with other members of the Health Portfolio as well as partners across the Government of Canada. As part of this work Health Canada provides health services to Internationally Protected Persons when they are visiting Canada for international events such as summit meetings or international sporting events. Together, these specialized health services work to ensure continuity of services and capacity in day to day operations as well as in extraordinary and unpredictable circumstances such as a national emergency or disease outbreaks such as H1N1.
| Total Budgetary Expenditures (Main Estimates) 2012-13 |
Planned Spending 2012-13 |
Total Authorities (available for use) 2012-13 |
Actual Spending (authorities used) 2012-13 |
Difference 2012-13 |
|---|---|---|---|---|
| 21.7 | 21.7 | 24.3 | 19.9 | 1.8 |
Notes: The increase of $2.6M from planned spending to total authorities is mainly due to payments required by collective agreements.
| Planned 2012-13 |
Actual 2012-13 |
Difference 2012-13 |
|---|---|---|
| 299 | 211 | 88 |
Notes: A refocused service delivery mandate and restructuring of operations across the regions resulted in resource savings not anticipated in the Report on Plans and Priorities for 2012-13. Most reductions in FTEs were achieved through attrition and voluntary departures.
| Expected Results | Performance Indicators | Targets | Actual Results |
|---|---|---|---|
| 1. Timely system response to public service employees with psycho-social health problems. | # and % of public service employee clients' psycho-social problems dealt with within service standards. | 70% (represents the current Industry standard). | 97% |
| 2. Coordinated, effective emergency response. | Congruity between planned and executed emergency response (includes plans for Internationally Protected Persons). | N/A (Note: The Emergency Preparedness and Response is defined in the Health Portfolio Emergency Response Plan (HPERP), which was signed in January 2010. After an event, an After-Action Report is developed in consultation with all parties involved in responding to the emergency to assess the response and deficiencies/gaps. The gaps/deficiencies are addressed in regular updates to the HPERP.) |
There was no emergency response situation during the reporting period. Health Canada updated the Federal Nuclear Emergency Plan to include the Government's response to the March 2011 tsunami and corresponding nuclear accident in Japan and to align with the Federal Emergency Response Plan. |
Performance Analysis and Lessons Learned
Health Canada exceeded its target of providing timely psycho-social and occupational health support to employees across the public service while managing significant increases in volume. In 2012-13, Employee Assistance Services experienced growth in business volume reaching $14 M in revenues. The increase was linked to supporting the federal public service in managing concerns related to workforce adjustment and new Interdepartmental Letters of Agreement with the RCMP for 21,000 members and with the Department of National Defence for 26,000 civilian employees.
Health Canada continued to ensure that the department met its emergency management obligations and updated the Federal Nuclear Emergency Plan (FNEP) to include the government's response to the March 2011 tsunami. A program to validate the new edition of the plan and improve national nuclear emergency preparedness was launched, including awareness training for members of the FNEP Technical Assessment Group and initial planning meetings for a full-scale, multi-jurisdictional exercise to be conducted in 2014-15.
Two National nuclear emergency preparedness workshops were held (Ontario and New Brunswick) and brought together federal, provincial, municipal and nuclear industry stakeholders to review inter-jurisdictional response arrangements, clarify expectations and identify areas for improvement.
Health Canada also developed 92 health contingency plans for Internationally Protected Persons and their family members visiting Canada in 2012-13.
Sub-Program Reporting 1.2.1 Public Service Occupational Health and Safety
Sub-Program Description
This program sub-activity works to promote a healthy working environment for employees by ensuring that specific categories of public servants, who may be exposed to additional health risks due to the type of work, receive the support they need before physical or psychological injury occurs. These preventative measures also help reduce the pressure on the public health care system as well as ensure a productive public service. This program sub-activity also provides support to federal departments and agencies with respect to the occupational health needs of their employees through the provision of Employee Assistance Services and Occupational Health Services. Occupational health services delivered to public servants include: pre-placements, pre-posting, cross-posting, return from-posting, periodic health evaluations, fitness-to-work evaluations, communicable disease services as well as the maintenance of the Occupational Health Assessment Guide. The Public Service Health Program (PSHP) has streamlined its services to improve its efficiency and it is currently researching means to assess its cost-effectiveness.
| Planned Spending 2012-13 |
Actual Spending 2012-13 |
Difference 2012-13 |
|---|---|---|
| 17.4 | 14.9 | 2.5 |
| Planned 2012-13 |
Actual 2012-13 |
Difference 2012-13 |
|---|---|---|
| 254 | 172 | 82 |
Notes: A refocused service delivery mandate and restructuring of operations across the regions resulted in resource savings not anticipated in the Report on Plans and Priorities for 2012-13. Most reductions in FTEs were achieved through attrition and voluntary departures.
| Expected Results | Performance Indicators | Targets | Actual Results |
|---|---|---|---|
| 1. Canadian federal public servants receive occupational health services (health evaluations and communicable disease services) in support of their work requirements. | % of occupational health services provided within applicable service standards. # of services provided by type to maintain the occupational health of Canadian federal public servants (schedule I and IV). |
Target: 80% | Service Standards to be measured once new tracking system is implemented. An estimated 26,088 services were provided to maintain the occupational health of Canadian federal public. |
| 2. Timely system response to public service employees with psycho-social, illness and injury health problems. | # and % of public service employee clients' psycho-social, illness and injury problems dealt with within service standards. | Target: 70%* *(This standard relates to the number of clients that achieve problem resolution within Employee Assistance Service's' short-term solution focused counselling. This is industry standard. The other 30% are provided treatment and resource options to deal with their long-term / specialized needs outside the realm of EAP). |
97% of public service employees achieve problem resolution within EAS's short term solution focused intervention model. (A total 13,110 cases, of which 12,745 cases were dealt with within the service standards.) |
Sub-Program 1.2.1 Narrative
A recent internal audit of the Public Service Health Program (PSHP) found that the program was well managed adapted well to human resource challenges while delivering services across the country. In response to an audit recommendation, the PSHP developed and implemented performance measures and services standards to better monitor and assess the program's service delivery and client satisfaction in support of ongoing improvement.
Another audit recommendation identified the need for an integrated occupational health information system that would support PSHP's business processes. In response, Health Canada developed a business case and high-level business requirements to build a National Occupational Health Information System. The system will permit the PSHP to accurately measure services and report against their performance management framework, conduct business trend analysis, and enhance client management.
Health Canada continued to be an important partner in occupational health for government employees as illustrated by its participation in over 20 Interdepartmental Hardship Post Committee meetings in the past year. In 2012-13, as part of its role under the Foreign Service directives, resources from Health Canada travelled to hardship posts to evaluate the availability and level of health care services for Canada-based employees and their dependants posted overseas.
Specialized organizational services experienced a significant growth in business directly related to supporting the federal public service in managing work force adjustment related concerns with total revenue of $3.2 M in 2012-13 in comparison to $1.6 M in the previous year.
Sub-Program Reporting 1.2.2 Emergency Management
Sub-Program Description
This program provides essential and centralized emergency management coordination, expertise and technical advice to address emergencies that pose risks to the health of Canadians and the environment (e.g., radio-nuclear, chemical, and disease outbreaks such as avian-flu). While the Public Health Agency of Canada is the portfolio lead for emergency preparedness, Health Canada is the lead federal department responsible for coordinating the response to a nuclear or radiological emergency under the Federal Nuclear Emergency Plan (FNEP). The Department also provides support and scientific expertise for chemical emergencies through the Chemical Emergency Response Unit (CERU), and the Internationally Protected Persons (IPP) Program prepares health plans and provides food surveillance for foreign dignitaries visiting Canada in support of the GOC's legal obligation to protect the health of such visiting IPPs under International Law. Activities include the preparation of emergency management plans in respect to identified risks and the implementation, maintenance, testing and exercising of these plans.
| Planned Spending 2012-13 |
Actual Spending 2012-13 |
Difference 2012-13 |
|---|---|---|
| 4.3 | 5.0 | -0.7 |
Note: Additional resources were allocated to support preparedness exercises in 2012.
| Planned 2012-13 |
Actual 2012-13 |
Difference 2012-13 |
|---|---|---|
| 45 | 39 | 6 |
| Expected Results | Performance Indicators | Targets | Actual Results |
|---|---|---|---|
| 1. Rapid response capability in emergency situations. | a) % of HC items addressed on the Public Safety Canada action plan for emergency preparedness. b) # of table-top exercises performed by:
|
Target: a) 100% b) None - As required for preparedness. |
a) 100% of HC items were addressed on the PSC action plan for emergency preparedness. b) Three (3) table-top exercises were conducted by the Federal Nuclear Emergency Plan (FNEP): 1) RadEx 2012: Full day scripted tabletop exercise to test response capabilities in collaboration with federal, provincial and municipal partners. Results will be used to identify areas for improvement. |
| 2. Timely access to health services for target populations. | % of services offered within service standards by:
|
Target: The target is that plans will be developed and completed before the visit as deemed necessary by the event organizer and RCMP (who determine the security level assigned to the visiting Internationally Protected Persons). | 92 health plans were completed. Emergency Health Plans were completed and submitted to client Departments 24 hours prior to the arrival of the IPP. |
Sub-Program 1.2.2 Narrative
While the Public Health Agency of Canada is the portfolio lead for emergency preparedness, Health Canada continued to ensure that the department met its emergency management obligations. The Federal Nuclear Emergency Plan, 5th edition was endorsed by the Deputy Ministers Emergency Management Committee in October 2012. Health Canada led the revision of the FNEP in collaboration with federal, provincial and industry partners. An exercise was conducted to introduce members of the Technical Assessment Group (TAG) to the revised FNEP. Results from this exercise will be used to inform the refinement of operational protocols supporting the FNEP. The Internationally Protected Persons (IPP) Program played a crucial role in the Government of Canada's international obligations under customary international law, ensuring the health protection of IPPs who visited Canada for regular visits or to participate in international events.
Program 1.3: Official Language Minority Community Development
Official language minority community development involves the administration of Health Canada's responsibilities under Section 41 of the Official Languages Act committing the federal government to enhancing the vitality of English-speaking and French-speaking minority communities as well as fostering the full recognition and use of both English and French in Canadian Society and the provision of policy and program advice relating to the Act. Administration involves consulting with Canada's official language minority communities on a regular basis, supporting and enabling the delivery of contribution programs and services for official language minority communities, reporting to Parliament and Canadians on Health Canada's achievements under Section 41, and coordinating Health Canada's activities and awareness in engaging and responding to the health needs of official language minority communities.
| Total Budgetary Expenditures (Main Estimates) 2012-13 |
Planned Spending 2012-13 |
Total Authorities (available for use) 2012-13 |
Actual Spending (authorities used) 2012-13 |
Difference 2012-13 |
|---|---|---|---|---|
| 39.9 | 39.9 | 39.9 | 39.0 | 0.9 |
| Planned 2012-13 |
Actual 2012-13 |
Difference 2012-13 |
|---|---|---|
| 12 | 7 | 5 |
Notes: The variance between planned and actual FTE utilization is the result of simplifying and streamlining operations to focus on core activities related to access to health care in the minority languages of Canadians.
| Expected Results | Performance Indicators | Targets | Actual Results |
|---|---|---|---|
| 1. Increased number of health professionals available to provide health services in official language minority communities (OLMCs). | # of health professionals who successfully completed training programs (funded by Health Canada), by:
|
Francophone: 1,406 graduates over 5 years. |
For the academic year ending in July 2012, 596 Francophone graduates completed training programs in Francophone post-secondary institutions outside of Quebec. |
| Anglophone: Second language training - approximately 8,000 people over 5 years (by March 31, 2013). | For the academic year ending in July 2012, 1,528 Health professionals in Quebec completed English language training courses and 6 completed French courses 86% of francophone health professionals outside of Quebec who completed Health Canada funded training programs work in OLMCs. | ||
| 2. Improved integration of OLMC health needs into the health system. | # of changes in legislative or public policies addressing the health needs of OLMCs (type of change, purpose, OLMC need addressed, location). | Presence of an integration plan for each area where there is a network and reports on the implementation and results achieved (by March 31, 2013). | Changes to P/T legislative policies/procedures to improve access to health care to OLMCs are achieved: 1 in Prince Edward Island, 3 in Quebec, 2 in Ontario. |
Performance Analysis and Lessons Learned
Health Canada continued to administer its responsibilities under the Official Languages Act. A key vehicle for this work continued to be the management of the Official Languages Health Contribution Program, which supports health projects focusing on access to health care in minority language communities.
During 2012-13, there were 26 active contribution agreements as part of the Official Languages Health Contribution Program. Funding for recipients of the program totalled $38.3 million, and payments were made in a timely manner.
In a November 2012 report by the Parliamentary Standing Committee on Official Languages, Health Canada is referenced as a success for putting in place a tripartite cooperation model that respects the Government of Quebec's jurisdiction and engages organizations that work with official language minority communities. It further recommends that this model be used by other federal institutions to improve access to English-speaking communities in the province of Quebec.
Strategic Outcome 2: Canadians are informed of and protected from health risks associated with food, products, substances and environments, and are informed of the benefits of healthy eating
This Strategic Outcome seeks to ensure that the food that Canadians eat and products they use are as safe as possible and that threats to health are addressed effectively. It helps increase Canadians' understanding of factors that influence everyone's health such as environmental conditions and nutrition. It helps to limit the use and abuse of tobacco and illicit drugs.
Program 2.1: Health Products
Sub-Programs:
- 2.1.1: Pharmaceutical Drugs
- 2.1.2: Biologics and Radiopharmaceuticals
- 2.1.3: Medical Devices
- 2.1.4: Natural Health Products
Program 2.2: Food Safety and Nutrition
Sub-Programs:
- 2.2.1: Food Safety
- 2.2.2: Nutrition and Healthy Eating
Program 2.3: Environmental Risks to Health
Sub-Programs:
- 2.3.1: Climate Change
- 2.3.2: Air Quality
- 2.3.3: Water Quality
- 2.3.4: Health Impacts of Chemicals
- 2.3.5: Public Health Inspections on Passenger Conveyances
Program 2.4: Consumer Products Safety
Program 2.5: Substance Use and Abuse
Sub-Programs:
- 2.5.1: Tobacco
- 2.5.2: Controlled Substances
Program 2.6: Radiation Protection
Sub-Programs:
- 2.6.1: Environmental Radiation Monitoring and Protection
- 2.6.2: Radiation Emitting Devices
- 2.6.3: Dosimetry Services
Program 2.7: Pesticide Safety
Program 2.1: Health Products
This Program Activity is responsible for regulating a broad range of health products that affect the everyday lives of Canadians. Under the authority of the Food and Drugs Act and its Regulations, and the Department of Health Act, the Program Activity evaluates and monitors the safety, quality and efficacy of human and veterinary drugs , biologic and genetic therapies, radio-pharmaceuticals, medical devices, and natural health products so that Canadians have access to safe and effective health products. This Program Activity also verifies, through compliance monitoring and enforcement activities that regulatory requirements for health products are met. In addition, the program provides timely, evidence-based and authoritative information to key stakeholders including, but not limited to, health care professionals such as physicians, pharmacists, natural health practitioners and members of the public to enable them to make informed decisions about the use of health products.
| Total Budgetary Expenditures (Main Estimates) 2012-13 |
Planned Spending 2012-13 |
Total Authorities (available for use) 2012-13 |
Actual Spending (authorities used) 2012-13 |
Difference 2012-13 |
|---|---|---|---|---|
| 158.9 | 158.9 | 164.7 | 164.7 | -5.8 |
Notes: The increase of $5.8M from planned spending to total authorities is mainly due to payments required by collective agreements.
| Planned 2012-13 |
Actual 2012-13 |
Difference 2012-13 |
|---|---|---|
| 2,174 | 1,899 | 275 |
Notes: The variance between planned and actual FTE utilization is mainly due to lower than projected revenues based on actual demand for regulatory reviews in 2012-13 and the resulting alignment of staffing to match workload.
| Expected Results | Performance Indicators | Targets | Actual Results |
|---|---|---|---|
| 1. Increased awareness of the benefits and risks associated with the use of health products. | % of the target population aware of the benefits and risks associated with the use of health products. Examples include, but are not limited to:
|
Annual increases. | There is no data available at this time as a Public Opinion Research Survey was not done. Given restrictions with respect to Public Opinion Research Surveys, we are exploring other mechanisms to collect this data i.e. reviewing published literature. |
| 2. Timely regulatory decisions for health products. | % of regulatory decisions made within service standards by type (Pre-market submissions): | Pharmaceuticals: 95% Brand Name and 32% Generics |
|
|
Pharmaceuticals - human - 90%. Pharmaceuticals - veterinary - 90%. |
Pharmaceuticals - veterinary - 83% |
|
|
Biologics and radiopharmaceuticals - 90%. |
Biologics and radiopharmaceuticals: 100% |
|
|
Medical devices - 90%. |
Medical devices: 82% |
|
|
Natural health products - TBD after backlog resolved. (Note: New targets being developed for 2013-14.) |
Natural health products: 75% |
|
| 3. Timely regulatory response for health product risks. | % of compliance/surveillance activities reviewed within service standards by type: | No targets were set for 2012-13. | |
|
Health Product incidents 11,267 opened and 10,423 closed. |
||
|
97% of Health Product inspections (excluding NHP) completed based on planned target (either inspected or withdrawn) and 323 unplanned inspections were conducted for a total of 1,353 completed. | ||
|
The establishment licensing service standards of an average of 250 days (Pharma) and 120 days (MD) for the year were met. | ||
|
856 Health Product lab samples tested. | ||
| Post-market safety assessments: | Post-Market Safety Assessments: 90% completed. | Post market safety assessment |
|
|
Pharmaceuticals: 94% |
||
|
Biologics and radiopharmaceuticals: 99% |
||
|
Medical devices: 100% |
||
|
Natural health products: 67% |
Performance Analysis and Lessons Learned
Health Canada is the largest federal regulator and endeavours to minimize health risk factors and maximize the safety provided by the regulatory system for drugs and health products.
Health Canada continued to implement a three-year plan (2011-13) to make optimal and more consistent use of foreign regulatory information. In 2012-13, the department implemented Year 3 of the Use of Foreign Reviews pilot project. Health Canada recognized that the pilot was experiencing a lower number of submissions than expected. In response, the scope was expanded and promoted on the web to increase interest.
Health Canada advanced several projects as part of the Regulatory Cooperation Council (RCC) initiative aimed at reducing the regulatory burden for health products. In 2012-13, Health Canada and the U.S. Food and Drug Administration (FDA):
- Completed the technical requirements and the operational concept review for the creation of a Canadian node on the U.S. Electronic Submission Gateway. The Gateway will allow industry applicants to make electronic health product submissions to both Health Canada and the FDA.
- Announced the first pilot project of the RCC Over-the-Counter Common Monograph Working Group. The first area of alignment is common cold indications for certain over-the-counter antihistamine ingredients.
- Exchanged inspection reports on Canadian manufacturing facilities for drugs and personal care products to assess each other's regulatory systems, operational frameworks, and drug establishment inventories / facility lists.
Health Canada also enhanced public involvement to support integrating transparency, openness and accountability in a modernized regulatory system. The department selected to pilot a Patient and Consumer Participation Pool to seek the views of a wider variety of patients and consumers, drawing on tools designed to enhance public understanding of the regulatory process. Two consultations used the Pool in 2012-13.
Sub-Program Reporting 2.1.1 Pharmaceutical Drugs
Sub-Program Description
The Pharmaceutical Drugs program sub-activity regulates pharmaceutical drugs for human and animal use. Prior to being given market authorization, a manufacturer must present substantive scientific evidence of a product's safety, effectiveness and quality as required by the Food and Drug Regulations. Drug regulated products include prescription and non-prescription pharmaceuticals, disinfectants and sanitizers with disinfectant claims. The program sub-activity also conducts compliance monitoring and enforcement activities related to health products. In addition, the program sub-activity provides information to health care professionals and other stakeholders to make informed recommendations to Canadians and to members of the public to enable them to make informed decisions.
| Planned Spending 2012-13 |
Actual Spending 2012-13 |
Difference 2012-13 |
|---|---|---|
| 69.7 | 67.0 | 2.7 |
| Planned 2012-13 |
Actual 2012-13 |
Difference 2012-13 |
|---|---|---|
| 1,119 | 925 | 194 |
Notes: The variance between planned and actual FTE utilization is mainly lower than projected revenues based on actual demand for regulatory reviews in 2012-13 and the resulting alignment of staffing to match workload.
| Expected Results | Performance Indicators | Targets | Actual Results |
|---|---|---|---|
| 1. Increased awareness of the benefits and risks associated with the use of Pharmaceutical Drugs. | % of the target population aware of the benefits and risks associated with the use of pharmaceutical drugs. Examples include but are not limited to:
|
Target: No target set for 2012-13. | There is no data available at this time as a Public Opinion Research Survey was not done. Given restrictions with respect to Public Opinion Research Surveys, we are exploring other mechanisms to collect this data i.e. reviewing published literature. |
| 2. Timely regulatory decisions for Pharmaceutical Drugs. | % of regulatory decisions made within service standards by type:
|
Target: Pre-market submissions - 90% |
Pre-market submissions New Drug Submission (NDS): 96% Supplemental New Drug Submission (SNDS): 95% Drug Identification Number Applications (DINA): 95% Abbreviated New Drug Submission (ANDS): 24% Supplemental Abbreviated New Drug Submission (SANDS): 59% Notifiable Change (NC): 68% Pre-Market Veterinary Drugs Directorate VDD: |
| Clinical Trials and Special Access Program – 100% of decisions within service standard. | 83% New Drug Submission (NDS), Supplemental New Drug Submission (SNDS), Abbreviated New Drug Submission (ANDS), Supplemental Abbreviated New Drug Submission (SANDS) Clinical trials: 99.5% Special access: 99.8% |
||
| 3. Timely regulatory response for Pharmaceutical Drug risks. | % of compliance/surveillance activities completed within service standards by type:
|
Target: No target set for 2012-13. |
Drug incidents 687 opened and 809 closed; Good Clinical Practices incidents 19 opened and 6 closed. 91% of inspections completed based on planned target (either inspected or withdrawn) and 164 unplanned inspections were conducted for a total of 645 completed. The establishment licensing service standard of an average of 250 days for the year was met. 762 Lab samples tested. |
Post-market safety assessments:
|
Post-Market Safety Assessments - 90%. | 94% for post market safety assessments. 96% Periodic Safety Update Report (PSUR). 92% Review. |
Sub-Program 2.1.1 Narrative
Health Canada met most of its performance targets for pharmaceutical and veterinary drugs, including internationally mandated time-sensitive targets for the review of pharmaceutical drugs. For example, brand name drugs with a new active substance have a review target of 300 days, and these were reviewed in 256 days on average in 2012-13. Performance targets for inspection and licensing activities and post market surveillance were also met in most cases.
The exception was the review of generic drugs, which did not meet its time targets. This was due to several factors, including intensive work on reducing the existing generics submissions backlog, an approach that has the current endorsement of industry, and managing the GoC's response to a prolonged drug shortage situation. The generic drug submission backlog had grown for several reasons, including an increase in branded drugs going off patent; increased globalization that brought an increase in the number of generics companies' submissions; and a review workload that increased 91% from 2006-07 to 2011-12.
Since April 2011, Health Canada has been able to dedicate significantly increased resources to generic drug approvals. The department has also introduced new ways to improve performance, including using foreign review reports and streamlining the review process. In 2012/13, the department implemented further process improvements, and reduced the generic drug submissions backlog by 52%, from 184 submissions in backlog to 89. The number of review decisions for generic drugs significantly increased in 2012-13, with a total of 438 decisions made that year, compared to 244 in 2011-12, an increase of 79%. In 2013-14, Health Canada anticipates that the generic submissions backlog will be eliminated.
In 2012-13, the department responded to emerging risks such as drug shortages and worked to help maintain a supply of high quality, safe and effective drugs. In addition, the department launched a Safety Labelling Stakeholder Notification System in February 2013 to improve Canadians access to safety information on drug products.
Health Canada and the Therapeutic Goods Administration (TGA) of Australia piloted a Regulatory Cooperation Initiative in the area of pharmaceuticals. Health Canada has also played a leadership role in multilateral initiatives such as, the International Generic Drug Regulators Pilot (IGDRP) and the Heads of Agencies Consortium that includes drug regulatory authorities of Canada, Australia, Singapore and Switzerland. This high level of international collaboration has yielded direct benefits for the Canadian regulatory system by enhancing the department's ability to use foreign reviews for generic drugs, adopt best practices, promote information exchange and work sharing arrangements.
As part of the Regulatory Cooperation Council (RCC), Health Canada and the FDA completed four observational Pharmaceutical Good Manufacturing Practices (GMP) inspections in each other's jurisdictions and are now in the process of analysing the information. The outcome of these observational inspections will inform the next steps in determining mutual reliance on GMP inspections.
Additionally under RCC, Health Canada and the FDA completed the first near simultaneous review and approval of a veterinary drug application, developing a model for future collaboration and joint reviews. The department also launched a program for registering low risk veterinary health products. It facilitates timely access to low risk products while ensuring resources are allocated according to the related risk of the veterinary product. In 2012-13, 232 low risk veterinary health products were registered.
Sub-Program Reporting 2.1.2 Biologics and Radiopharmaceuticals
Sub-Program Description
The Biologics and Radiopharmaceuticals program sub-activity regulates biological products (products derived from living sources) for human use. Prior to being issued a market authorization, a manufacturer must present substantive evidence of a product's safety, effectiveness and quality as required under the Food and Drug Regulations. Some of the products regulated include blood and blood products, viral and bacterial vaccines, gene therapy products, tissues, organs and xenografts, which are manufactured in Canada or elsewhere. The program sub-activity also conducts compliance monitoring and enforcement activities related to health products. In addition, the program sub-activity provides health care professionals and other stakeholders with the information that they need to make informed recommendations to Canadians about biologics including vaccines, blood products, radiopharmaceuticals and other treatments as well as provides information to members of the public to enable them to make informed decisions.
| Planned Spending 2012-13 |
Actual Spending 2012-13 |
Difference 2012-13 |
|---|---|---|
| 53.8 | 56.9 | -3.1 |
Notes: The variance between planned and actual spending is mainly due to payments required by collective agreements.
| Planned 2012-13 |
Actual 2012-13 |
Difference 2012-13 |
|---|---|---|
| 498 | 444 | 54 |
Notes: The variance between planned and actual FTE utilization is mainly lower than projected revenues based on actual demand for regulatory reviews in 2012-13 and the resulting alignment of staffing to match workload.
| Expected Results | Performance Indicators | Targets | Actual Results |
|---|---|---|---|
| 1. Increased awareness of the benefits and risks associated with the use of Biologics and Radio-pharmaceutical Products. | % of the target population aware of the benefits and risks with the use of Biologics and Radiopharmaceutical Products. Examples include but are not limited to:
|
Target: Annual increases. | There is no data available at this time as a Public Opinion Research Survey was not done. |
| 2. Timely regulatory decisions for Biologics and Radiopharmaceutical Products. | % of regulatory decisions made within service standards by type:
|
Target: Pre-market submissions-90%. Clinical Trials- 100%. Special Access Program-100% of decisions within service standard. |
Pre-market submissions - 100%. Clinical Trials-100%. Special Access Program - 100%. |
| 3. Timely regulatory response for Biologics and Pharmaceutical Product Risks. | % of compliance/surveillance activities reviewed within service standards by type:
Post-market safety assessments:
|
Target: No target set. Target: Post Market Safety Assessments: 90%. |
Blood, Semen, Cell Tissues and Organs (CTO) incidents 17 opened and 55 closed. 100% of inspections completed based on planned target. All of the planned inspections were completed (either inspected or withdrawn) and 5 unplanned inspections were conducted for a total of 125 completed inspections. There was no laboratory activity. 99% for biologics and Radiopharmaceuticals post market safety assessments. |
Sub-Program 2.1.2 Narrative
Health Canada met all of its performance targets for the review of biologic product submissions and compliance and surveillance activities.
During 2012-13, Health Canada completed the final stages of accreditation work and in April 2013, it received International Organization for Standardization (ISO) 17025 accreditation from the Standards Council of Canada for its biologics drug product laboratories. This accreditation will allow for greater international collaboration to assess the safety of biologics through better leveraging of laboratory evaluations. In 2012-13, the department worked in collaboration with international partners to develop tools and methods for improving the quality of influenza and chicken pox vaccines.
The department also signed a Memorandum of Understanding (MOU) with the European Directorate for the Quality of Medicines in July 2012 to facilitate the exchange of information on the quality assessment of vaccines and blood products for more informed risk decision-making. In addition, a new CTO risk-based inspection strategy was implemented in November of 2012 to systematically schedule inspections based on risk and the past compliance history of the CTO establishment.
The department transitioned full responsibility for the administration of the Assisted Human Reproduction Act from Assisted Human Reproduction Canada to the Biologics Program.
Sub-Program Reporting 2.1.3 Medical Devices
Sub-Program Description
The Medical Devices program sub-activity regulates medical devices for human use. Prior to being given market authorization, a manufacturer must present substantive scientific evidence of a medical device's safety, effectiveness and quality as required by the Medical Devices Regulations. Medical devices cover a wide range of health or medical instruments used in the treatment, mitigation, diagnosis or prevention of a disease or abnormal physical conditions. The program sub-activity also conducts compliance monitoring and enforcement activities related to medical devices. In addition, the program sub-activity provides health care professionals and other stakeholders with the information that they need to make informed recommendations to Canadians as well as to members of the public to enable them to make informed decisions.
| Planned Spending 2012-13 |
Actual Spending 2012-13 |
Difference 2012-13 |
|---|---|---|
| 13.7 | 13.0 | 0.7 |
| Planned 2012-13 |
Actual 2012-13 |
Difference 2012-13 |
|---|---|---|
| 270 | 276 | -6 |
| Expected Results | Performance Indicators | Targets | Actual Results |
|---|---|---|---|
| 1. Increased awareness of the benefits and risks associated with the use of medical devices. | % of the target population aware of the benefits and risks with the use of Medical Devices. Examples include but are not limited to:
|
Target: Annual increases. | There is no data available at this time as a Public Opinion Research Survey was not done. |
| 2. Timely regulatory decisions for Medical Device Products. | % of regulatory decisions made within service standards by type:
|
Target: Pre-market applications - 90%, and Investigational Testing (clinical trials) - 100% of decisions within service standard; and for Special Access - 99.9% of requests responded to within service standards. |
Pre-market: Class II (63%) Class III (79%) Class IV (81%) Investigational Testing: 91% Special Access Program: 97% |
| 3. Timely regulatory response for Medical Device Product risks. | % of compliance/surveillance activity completed within service standards by type:
Post-market safety assessments:
|
Target: No target set. Target: Post-Market Assessments - 90% (Post-Market Surveillance Activity, Signal Assessment and Ad Hoc review) complete within the accepted standard completion time. |
Medical Device incidents 102,201 opened and 9,008 closed. 100% of medical device inspections completed. Inspection plans were met with a total of 583 inspections conducted (429 planned and 154 unplanned). Met the service standard of 120 days average for establishment licensing. There was no laboratory activity. 100% for medical devices post-market assessment. |
Sub-Program 2.1.3 Narrative
Health Canada continued to meet service standards for special access, and investigational testing (clinical trials) for medical devices. While timeliness was a challenge for some pre-market classes, Health Canada met all performance targets set by regulation. Compliance and surveillance activity, post-market assessments and medical device establishment licenses were also completed within service standards.
A new Medical Devices Inspection Strategy was implemented in 2012-13, which includes a 3 to 5 year inspection cycle for manufacturers, importers and distributors. The strategy establishes a proactive and systematic inspection approach to increase compliance of the medical device industry. The department also completed and updated a number of guidance and standard documents for Industry to improve product safety and/or provide the information necessary to comply with regulations.
In the area of medical device regulation, achieving harmonised requirements and convergent practices is necessary to respond to a globalised manufacturing market and the increasing demands to streamline regulatory processes. A key forum for achieving this harmonisation is the International Medical Device Regulators Forum (IMDRF) that includes Australia, Brazil, Europe, Japan, the United States and Canada, which was launched in February 2012. In September 2012, the department hosted an IMDRF meeting and contributed to its ongoing work of accelerating international medical device regulatory harmonization for improved safety, effectiveness and quality of medical devices.
Sub-Program Reporting 2.1.4 Natural Health Products
Sub-Program Description
The Natural Health Products program sub-activity regulates natural health products available to Canadians for human use. Prior to being given market authorization, a manufacturer must submit detailed information on the product=s safety, efficacy and quality as required under the Natural Health Products Regulations. Products that fall within these Regulations include herbal remedies, homeopathic medicines, vitamins, minerals, traditional medicines, probiotics, amino acids and essential fatty acids. The program sub-activity is also responsible for compliance monitoring and enforcement activities related to natural health products. In addition, the program sub-activity provides health care practitioners (for example, pharmacists, Traditional Chinese Medicine (TCM) practitioners, herbalists, naturopathic doctors, etc.) and other stakeholders with the information that they need to make informed recommendations to Canadians.
| Planned Spending 2012-13 |
Actual Spending 2012-13 |
Difference 2012-13 |
|---|---|---|
| 21.6 | 27.8 | -6.2 |
Notes: The variance between planned and actual spending is mainly due to payments required by collective agreements and higher than projected demand by manufacturers for regulatory reviews under the Natural Health Products program.
| Planned 2012-13 |
Actual 2012-13 |
Difference 2012-13 |
|---|---|---|
| 286 | 252 | 34 |
Notes: The variance between planned and actual FTE utilization is mainly due to savings achieved through simplifying and streamlining operations while maintaining regulatory activity. Most reductions in FTEs were achieved through attrition and voluntary departures.
| Expected Results | Performance Indicators | Targets | Actual Results |
|---|---|---|---|
| 1. Increased availability of safe, effective and high quality Natural Health Products. | % of Product Licence Applications (PLAs) approved (vs. those in queue). % of PLAs refused (vs. those assessed). # of Exemption Numbers issued. |
Target: Currently being developed - program to confirm in Fall 2011. (Note: No Target was established. New service standards being developed and implemented in 2013-14.) |
85% of PLAs approved. 13 % of PLAs refused. 638 Exemption Numbers issued. |
| 2. Timely regulatory decisions for Natural Health Products. | % of regulatory decisions made within service standards by type:
|
Target: PCI product licensing decisions: 60 calendar days. Non PCI product licensing decisions: 180 calendar days. Clinical Trials: 90% of decisions issued within 90 calendar days. Site Licensing: no target set, service standard is under review. |
95% of PCI; 62% of Non-PCI; and 93 % of Clinical Trials decisions issued within service standard. The program sub-activity focused on meeting its regulatory requirement to clear submissions in backlog which affected performance against the Non-PCI service standard. The service standard and target for Site Licensing are under review. |
| 3. Timely regulatory response for Natural Health Product risks. | % of compliance/surveillance activities completed within service standards Pharmaceutical drugs (human only). Post-market safety assessments:
|
Target: No target set. Target: Post-market safety assessments - 90%. |
NHP incidents 340 opened and 545 closed. 94 Lab samples tested. 67% for natural health products post-market assessment. |
Sub-Program 2.1.4 Narrative
When the Natural Health Products Regulations came into force in 2004, they captured a large number of products that were already on the market and needed to be licensed. This created an immediate and large number of unprocessed product applications. In the first two full years, 1,128 natural health products (NHPs) were approved.
In 2010, the Natural Health Products (Unprocessed Product Licence Applications) Regulations (NHP-UPLAR) were introduced, as a temporary measure, allowing for the legal sale of lower-risk products while their applications were under review. During this temporary measure, ending on February 4, 2013, the program sub-activity focused its efforts on successfully completing reviews of 10,885 NHP pre-market applications that were in backlog. Addressing the backlog within the prescribed timeline impacted performance for other NHP regulatory decisions (i.e. 62% of regulatory decisions for Non-PCI were issued within the service standard).
To accelerate application reviews and focus evaluation efforts on complex applications, the government introduced a new approach to NHPs. This new approach introduced policies and process improvements, complemented by revised guidance on the requirements and pathways for licensing NHPs. As a result, in the last two years, the department has approved 15,343 NHPs - an increase of more than 1,300 percent from its original performance. To date, Health Canada has authorized more than 60,000 NHPs for sale and that number continues to grow.
In 2012-13, Health Canada led projects to increase the quantity and quality of identified new sources for adverse reaction reports. Its work with two regional Poison Control Centres proved effective in enhancing each other's information for signal detection and analysis. In addition, outreach projects to practitioners resulted in better working relationships with Health Canada.
Program 2.2: Food Safety and Nutrition
The Food Safety and Nutrition program activity establishes policies, regulations and standards related to the safety and nutritional quality of food. Food safety standards are enforced by the Canadian Food Inspection Agency and the Program Activity assesses the effectiveness of CFIA's activities related to food safety. The legislative framework for food is found in the Food and Drugs Act and Regulations, the Canadian Food Inspection Agency Act and the Department of Health Act. The Program Activity also promotes the nutritional health and well-being of Canadians by collaboratively defining, promoting, and implementing evidence-based nutrition policies and standards. As the focal point and authoritative source for nutrition and healthy eating policy and promotion, the Program Activity provides timely, evidence-based, and authoritative information to Canadians and stakeholders to enable them to make informed decisions and healthy choices.
| Total Budgetary Expenditures (Main Estimates) 2012-13 |
Planned Spending 2012-13 |
Total Authorities (available for use) 2012-13 |
Actual Spending (authorities used) 2012-13 |
Difference 2012-13 |
|---|---|---|---|---|
| 52.6 | 53.1 | 69.8 | 69.7 | -16.6 |
Notes: The increase of $16.6M from planned spending to total authorities is mainly due to the net effect of payments required by collective agreements and funding received as part of the Agriculture Regulatory Action Plan and the Healthy Eating and Awareness Campaign.
| Planned 2012-13 |
Actual 2012-13 |
Difference 2012-13 |
|---|---|---|
| 555 | 515 | 40 |
Notes: The variance between planned and actual FTE utilization is mainly due to savings resulting from simplifying and streamlining operations. Most reductions in FTEs were achieved through attrition and voluntary departures.
| Expected Results | Performance Indicators | Targets | Actual Results |
|---|---|---|---|
| 1. Improved healthy eating by Canadians. | % change in eating/ dietary practices of Canadians over time. | 20% increase from current value (42% of Canadians aged 18 and older reported that they consumed fruits and vegetables five or more times a day by March 31, 2015. (Note: Performance Indicator currently being revised.) |
The most recent data from 2011 indicates that 40.0% of Canadians aged 18 and older reported that they consumed fruits and vegetables five or more times a day. |
| 2. Responsiveness to external triggers related to nutritional and food safety risks through timely regulatory response and non-regulatory initiatives. | % of Health Risk Assessments (HRAs) conducted at Canadian Food Inspections Agency's (CFIA) request addressed and communicated to stakeholders within Service Standards. % of regulatory and non- regulatory initiatives in response to external triggers related to nutritional risks and food safety risks. |
90% of HRAs at Canadian Food Inspection Agency's request within time standards. Food Directorate develops regulatory and non-regulatory responses to 90% of external triggers. |
100% of HRAs at CFIA's request addressed and communicated to stakeholders within service standards. Food Directorate developed regulatory and non-regulatory responses to 100% of external triggers. |
| 3. Increased awareness of Canadians on the benefits and risks related to food safety, nutrition and healthy eating. | % of the target population aware of benefits and risks related to food safety, nutrition and healthy eating over time
(Note: Due to public opinion research limitations, the program may use proxy indicators associated with the outputs 'Information available' for 2.2.1 [Food Safety] and "Education tools developed and disseminated for Canadians and stakeholders" for 2.2.2 [Nutrition and Healthy Eating] as a measure of the % of the target population aware.) |
For food safety awareness, as described in the ‘Survey of Canadians' knowledge & behaviour related to Food Safety' was conducted in February 2010 by EKOS, a consulting firm. For nutrition and healthy eating, TBD based on baseline data (by the end of FY 09-10). (Note: About three in four Canadians indicated they have heard a great deal about proper cooking/cooling instructions (77%), safe food handling (74%), and proper storage of foods (73%). |
There is no data available at this time as a Public Opinion Research Survey was not conducted. However, according to a survey conducted by Praxicus and published by the Canadian Food Safety Alliance in December 2012, the safety of the food supply is a leading concern for Canadians. 88% of respondents reported being somewhat confident in the overall safety of the food supply. |
Performance Analysis and Lessons Learned
Health Canada modernized pre-market food review and approvals, enhanced its capacity to anticipate and respond to food safety incidents, and developed and implemented food safety and nutrition preventative measures.
Two targeted changes were made to the Food and Drugs Act to cut red tape and make the food regulatory system more efficient and flexible. The first change, “Marketing Authorizations,” simplified and accelerated the regulatory approval of certain new or modified health claims for foods as well as set safe levels of acceptable substances for foods, such as food additives. The second, "Incorporation by Reference" allowed a document or list that is not in the text of the regulations to be made a part of the regulations.
Health Canada reviewed all food products that had previously gained market access under the Natural Health Product Regulations and worked with industry to transition eligible products under the Food Regulatory Framework. The end goal of this transition was to ensure that products that look like foods and are consumed as foods are regulated as foods. In doing so, Canadians will be able to make more informed choices due to consistent nutrition information and labelling requirements.
Health Canada continued to advance a healthy eating policy in Curbing Childhood Obesity: A Federal, Provincial and Territorial Framework for Action to Promote Healthy Weights. The department completed three reports in collaboration with the federal/provincial/territorial Group on Nutrition: Measuring the Food Environment in Canada, Working with Grocers to Support Healthy Eating, and Healthy Eating After School - Integrating Healthy Eating into After-school Physical Activity Programs. These reports respond to the Framework's policy priorities to make environments more supportive of healthy eating and to increase the availability and accessibility of nutritious foods. These reports will provide governments and other stakeholders with current evidence to inform present and future policies, programs and research.
Sub-Program Reporting 2.2.1 Food Safety
Sub-Program Description
The Food Safety program sub-activity establishes standards, policies and regulations pertaining to food safety and nutritional risks as well as reviews and assesses the safety of food ingredients, veterinary drugs for food producing animals, processes and final foods. In addition, the program sub-activity conducts risk assessments pertaining to chemical and microbiological safety and nutritional quality of foods and assesses the effectiveness of the Canadian Food Inspection Agency's activities related to food safety. The program sub-activity also provides information about food safety to stakeholders and to Canadians to enable them to make informed decisions.
| Planned Spending 2012-13 |
Actual Spending 2012-13 |
Difference 2012-13 |
|---|---|---|
| 42.2 | 50.0 | -7.8 |
Notes: The variance between planned and actual spending is mainly due to payments required by collective agreements and to funding received for Food Fortification and Growing Forward initiative.
| Planned 2012-13 |
Actual 2012-13 |
Difference 2012-13 |
|---|---|---|
| 403 | 370 | 33 |
Notes: The variance between planned and actual FTE utilization is mainly due to savings achieved through simplifying and streamlining operations while maintaining regulatory activity. Most reductions in FTEs were achieved through attrition and voluntary departures.
| Expected Results | Performance Indicators | Targets | Actual Results |
|---|---|---|---|
| 1. Increased awareness of Canadians on the benefits and risks related to foods safety. | % of the target population aware of benefits and risks related to food safety:
(Note: Due to Public Opinion Research (POR) limitations, program may use proxy indicators associated with the outputs 'Information available' for 2.2.1 [Food Safety] as a measure of the % of the target population aware.) |
Target: For food safety awareness, as described in the ‘Survey of Canadians' knowledge & behaviour related to Food Safety' was conducted in February 2010 by EKOS, a consulting firm.
(Note: About three in four Canadians indicated they have heard a great deal about proper cooking/cooling instructions (77%), safe food handling (74%), and proper storage of foods (73%).) |
There is no data available at this time as a Public Opinion Research Survey was not done.
However, according to a survey conducted by Praxicus and published by the Canadian Food Safety Alliance in December 2012, the safety of the food supply is a leading concern for Canadians. 88% of respondents reported being somewhat confident in the overall safety of the food supply. |
| 2. Responsiveness to external triggers related to nutritional and food safety risks through timely regulatory response and non- regulatory initiatives. | % of Health Risk Assessments (HRAs) conducted at CFIA's request communicated to stakeholders within Service Standards for Identified Food borne Pathogens, Chemical Contaminants, veterinary drugs residues, and nutritional risks by:
# % of regulatory and non-regulatory initiatives in response to external triggers related to nutritional risks and food safety risks. |
Target: 90% of HRAs of all types and levels conducted at CFIA's request within time standards.
Food Directorate develops regulatory and non-regulatory responses to 90% of external triggers. |
100% of HRAs conducted at CFIA's request within the set time standard.
Food Directorate developed regulatory and non-regulatory responses to 100% of external triggers. |
| 3. Enhance Canadian Food Inspection Agency's food safety inspection program design and delivery, and HC's regulatory framework. | Note: To be determined based on the outcome of Health Products and Food Branch Senior Management Review of Food Safety Assessment Program. | Target: 3-5 improvements per assessment. | As a result of the Health Products and Food Branch Senior Management Review, the Food Safety Assessment Program was discontinued. |
Sub-Program 2.2.1 Narrative
Health Canada completed 100% of the health risk assessments of food products requested by the Canadian Food Inspection Agency within performance standards. Some backlog remains in reviews of food pre-market submissions, however all intermediate targets for backlog reduction in food additives, novel foods and infant formula were met by March 31, 2013.
As part of Bill C-38, amendments to the Food and Drugs Act came into force in 2012 that streamline and accelerate the process by which the department implements certain safety decisions regarding food additives. These changes enable Health Canada to more efficiently provide Canadians with access to safe food products and improve Health Canada's responsiveness to emerging science, food innovation, and/or health and safety risks.
In 2012-13, the department continued to enhance its risk management measures for priority food safety hazards, including through the publication of guidance documents. Health Canada also held technical discussions with stakeholders to seek input on proposed approaches for veterinary drug regulatory modernization
Sub-Program Reporting 2.2.2 Nutrition and Healthy Eating
Sub-Program Description
The Nutrition and Healthy Eating program sub-activity promotes and supports the nutritional health and well-being of Canadians by anticipating and responding to public health issues associated with nutrition and healthy eating, collaboratively defining, promoting and implementing evidence informed nutrition policies and standards providing timely and authoritative information to support and influence informed healthy eating choices by Canadians; and generating knowledge through research, surveillance and evaluation activities to support this mandate.
| Planned Spending 2012-13 |
Actual Spending 2012-13 |
Difference 2012-13 |
|---|---|---|
| 10.9 | 19.7 | -8.8 |
Notes: The variance between planned and actual spending is mainly due to payments required by collective agreements and increased activity in the Healthy Eating campaign.
| Planned 2012-13 |
Actual 2012-13 |
Difference 2012-13 |
|---|---|---|
| 153 | 144 | 9 |
| Expected Results | Performance Indicators | Targets | Actual Results |
|---|---|---|---|
| 1. Increased awareness by Canadians of the benefits of nutrition and healthy eating. | % of the target population aware of benefits of nutrition and healthy eating by:
(Note: Due to POR limitations, programs may have to use the proxy indicators associated with the outputs 'Information available' for 2.2.2 [Nutrition and Healthy Eating] as a measure of the % of the target population aware.) |
Target: Currently being developed - program to confirm in Fall 2011.
(Note: Performance Indicator currently being revised.) |
In 2010-11, Health Canada initiated the Nutrition Facts Education Campaign to increase consumers' knowledge and use of the Nutrition Facts table (NFt), specifically the % Daily Value (%DV) on packaged food labels.
In July 2012, a national tracking survey of Canadians' use and understanding of the NFt was conducted (The Strategic Counsel - POR 088-11). The survey found that approximately one-third (30%) of the target audience (mothers with children ages 2-12) recalled the NFt information campaign and the % Daily Value (% DV) logo. Just under half of those who reported seeing the % DV logo and NFt campaign say that it has altered the way they shop for groceries, for example, they now look at sodium content. In 2012, 72% reported that they always or often look at the NFt, as compared to 69% who reported such behaviour in 2010. |
| 2. Enhanced stakeholder awareness and use of improved policies, programs and initiatives to support nutrition and healthy eating. | # and/or description of initiatives/ regulations/legislative renewal using HC nutrition policies and standards by:
|
Target: Currently being developed - program to confirm in Fall 2011.
(Note: Performance Indicator currently being revised.) |
Data not collected in 2012-13. |
Sub-Program 2.2.2 Narrative
In 2012-13, Health Canada completed and released Nutrition for Healthy Term Infants: Recommendations from Birth to Six Months, a joint statement of Health Canada, Canadian Paediatric Society, Dietitians of Canada, and the Breastfeeding Committee for Canada. The statement provides health professionals with evidence-informed principles and recommendations to develop practical feeding guidelines for parents and caregivers in Canada, and to promote the communication of accurate and consistent messages on infant nutrition in the first six months. The department learned that the inclusion of a citizen representative on the Infant Feeding Expert Advisory Group helped to broaden the experience and perspectives reflected in the group and in their advice to Health Canada.
Health Canada collaborated on the Eat Well campaign with stakeholders from various organizations, including the Retail Council of Canada and the Canadian Federation of Independent Grocers, as well as the Heart and Stroke Foundation and Dietitians of Canada to develop tools and resources, and promote clear and consistent messages to help Canadians make informed food choices. The Eat Well campaign promotes healthy eating by providing consumers with information to help them make healthier choices at home, at the grocery store and when eating out.

 Program 2.3: Environmental Risks to Health
The environment continues to be a key determinant of health for all Canadians. This Program Activity aims to promote and protect the health of Canadians by identifying, assessing and managing health risks posed by environmental factors. The scope of activities includes: research on climate change, air quality, drinking water quality, chemical substances, and contaminated sites, clean air programming and regulatory activities, risk assessment and management of chemical substances, air pollutants, water contaminants, health impacts of climate change, products of biotechnology and products of other new and emerging technologies (including nanotechnology); and, working with the passenger conveyance industry to protect the health of the travelling public.
| Total Budgetary Expenditures (Main Estimates) 2012-13 |
Planned Spending 2012-13 |
Total Authorities (available for use) 2012-13 |
Actual Spending (authorities used) 2012-13 |
Difference 2012-13 |
|---|---|---|---|---|
| 115.4 | 115.4 | 117.6 | 103.7 | 11.7 |
Notes: Of the $11.7M difference between planned and actual spending, $6.3M was allocated to support Radiation Protection (PA 2.6). The remaining variance of $5.4M between planned and actual spending is mainly due to delays in the staffing plan for the Chemical Management Plan and the Clean Air Agenda programs.
| Planned 2012-13 |
Actual 2012-13 |
Difference 2012-13 |
|---|---|---|
| 880 | 687 | 193 |
Notes: Of the 193 difference between planned and actual FTEs utilization, 41 FTEs were allocated to support Radiation Protection (PA 2.6). The remaining variance of 152 FTEs between planned and actual FTE utilization is mainly due to timing of staffing for the Chemical Management Plan and the Clean Air Agenda programs.
| Expected Results | Performance Indicators | Targets | Actual Results |
|---|---|---|---|
| Threats to the health of Canadians posed by environmental risks are reduced. | Trend data show improvements in air quality and health benefits. | Baseline for air quality and health benefit improvements to be set in 2013-14. Following that, air quality and health benefit improvements will be reported every three years, by percentage change over the period. | Baseline to be set in 2013-14 with reporting on results in 2016-17. |
| Trend data demonstrate increased development and application of adaptation strategies to address health risks from climate change. | A minimum of 5 new communities adopt and implement a heat alert and response system (HARS) to address the health risks from climate change over a 5 year period. (Note: Over a five year period or by March 31, 2016). | On target: 5 new partnerships agreements in support of the communities to develop and implement heat alert and response system plans were established in 2012-13 bringing the total number of communities working with HC to develop and implement HARS by 2016 to seven. | |
| Level of exposure to substances of concern. | Program is currently working to establish new targets based on baseline established in 2010. (Note: Based on Cycle 1 of the Canadian Health Measures Survey (CHMS), baseline levels in human blood for substances of concern were established for mercury, lead, cadmium and polybrominated diphenyl ethers (PBDE 47). CHMS Cycle 2 results (2009-2011) to be released in April 2013). |
Based on Cycle 1 of the CHMS, baseline levels in human blood for substances of concern were established:
|
Performance Analysis and Lessons Learned
Health Canada continued to provide expert advice and oversight to minimize the risks to Canadians posed by environmental factors.
In 2012-13, the department conducted risk assessments, health benefit analysis, research and outreach to improve air quality developed new Canadian Ambient Air Quality Standards and Residential Indoor Air Quality guidelines and regulations to reduce emissions from transportation, and increased coverage and awareness of the Air Quality Health Index.
Extreme heat poses a growing risk to the health and well-being of Canadians as climate change is expected to produce heat events with greater intensity, frequency and duration. By implementing appropriate preparation measures such as effective heat alert and response systems, the health risks of extreme heat can be minimized. In 2012-13, Health Canada met its target of establishing five new community agreements to develop and implement heat alert and response systems (HARS). This brings the total number of communities that will implement HARS by 2016 to seven. In addition, Health Canada provided guidance and expert advice to public health and emergency management officials on the development of HARS in at-risk regions, as well as, on the development of training tools for health professionals to reduce the vulnerability of their community to extreme heat.
Health Canada continued to implement the Chemicals Management Plan (CMP). Through the substance groupings initiative, rapid screening, and other approaches, Health Canada reached approximately 18% of the overall goal of assessing and managing the potential health and ecological risks associated with approximately 1,500 substances. The plan is on track, with 202 of the 227 planned assessments completed in 2012-13; 18 were published, with the balance expected to be published in 2013-14. The department also completed 41 CMP compliance promotion activities and 53 public outreach activities across regions.
Canadians are exposed to a variety of chemicals, both naturally-occurring and human-made, throughout their daily lives. Cycle 1 (2007-2009) of the biomonitoring component of the Canadian Health Measures Survey (CHMS) established baseline levels of exposure to environmental chemicals in human blood and/or urine. Baseline levels provide a starting point to help determine if the exposure is changing over time. Cycle 2 results (2009-2011) were released in April 2013 and data analysis will begin in 2013-14.
| FSDS Goals | FSDS Performance Indicators | FSDS Targets | FSDS Performance Status |
|---|---|---|---|
|
|
|||
| Goal 2 - Air Pollution: Minimize the threats to air quality so that the air Canadians breathe is clean and supports healthy ecosystems.
Goal 3 - Water Quality: Protect and enhance the quality of water so that it is clean, safe and secure for all Canadians and supports healthy ecosystems. |
2.3 and 3.12: |
Based on Cycle 1 of the CHMS, baseline levels in human blood for substances of concern were established:
Canadian Environmental Sustainability Indicators (CESI) Targets to be determined based on established baseline data. |
|
| Goal 2 - Air Pollution: Minimize the threats to air quality so that the air Canadians breathe is clean and supports healthy ecosystems. | Health-based assessments of priority indoor air pollutants and associated management tools (# of indoor air and CMP priority indoor pollutant assessments, guidelines, building or product standards). | 2.2: Help protect the health of Canadians by assessing indoor pollutants and developing guidelines and other tools to better manage indoor air quality. | Residential Indoor Air Quality Guidelines for naphthalene and benzene were published for public comment in the Canada Gazette Part I, and a final Guideline for fine particulate matter was issued. Indoor air quality continued to be a main focus of communications activities through, for example, the Hazardcheck: Hazards in Your Home campaign, and a new publication, titled, Our Health, Our Environment: A Snapshot of Environmental Health in Canada. |
| Goal 3 - Water Quality: Protect and enhance the quality of water so that it is clean, safe and secure for all Canadians and supports healthy ecosystems. | Drinking Water Quality: Health-based water guidelines (# of water guidelines/guidance documents approved by F/P/T Committee by product type.) | 3.11: Help protect the health of Canadians by developing health-based water guidelines/guidance documents. | Five guidelines/guidance documents have been approved by the F/P/T Committee on Health and Environment.
This includes:
|
FSDS Performance Summary
Health Canada contributed significantly to the Federal Sustainable Development Strategy (FSDS) in 2012-13 through its responsibilities related to air, water, climate change and chemicals management. Under the Chemicals Management Plan, Health Canada assessed the health risks of new and existing chemicals, developed risk management strategies, where needed, and undertook related research and monitoring activities. Health Canada also responded to stakeholder inquiries and increased Canadians' awareness of what they can do to reduce potential health risks. Health Canada continued to work in partnership with provinces and territories to safeguard drinking water supplies in Canada by developing Guidelines for Canadian Drinking Water Quality.
Health Canada also worked with Environment Canada to develop an additional Canadian Environmental Sustainability Indicator (CESI) which will be used as part of the FSDS. This indicator focuses on the root causes of drinking water advisories from a water quality perspective.
Recognizing the link between air quality and health, Health Canada continued to support the Government's Clean Air Regulatory Agenda(CARA). Health Canada, along with Environment Canada, worked with the provinces and territories and other key stakeholders to begin implementation of the Air Quality Management System, a new national framework for managing air quality, which includes new Canadian ambient air quality standards.
The Air Quality Health Index (AQHI) was expanded to more communities in 2012-13, making the AQHI available to approximately 63% of Canadians, and was made more accessible through a partnership with The Weather Network. In addition, more than 6,000 health professionals (e.g. physicians, nurses, respiratory therapists, asthma educators) received information and training on using the AQHI to protect health through courses, presentations and direct conversations. Health Canada continued to provide Canadians with the information they need to achieve healthy indoor environments, through Residential Indoor Air Quality Guidelines, the Hazardcheck: Hazards in Your Home campaign, a new publication titled, Our Health, Our Environment: A Snapshot of Environmental Health in Canada and the National Radon Awareness Campaign.
Sub-Program Reporting 2.3.1 Climate Change
Sub-Program Description
This activity advances the understanding of health impacts of climate change, and provides advice on adaptation strategies. Partnerships are forged with stakeholders to address risks to health, collaborate with researchers and policy-makers to assess and manage the potential risks to human health linked to climate change, and raise public awareness to enable Canadians to adapt to changes in climate.
| Planned Spending 2012-13 |
Actual Spending 2012-13 |
Difference 2012-13 |
|---|---|---|
| 1.7 | 1.7 | 0.0 |
| Planned 2012-13 |
Actual 2012-13 |
Difference 2012-13 |
|---|---|---|
| 12 | 12 | 0 |
| Expected Results | Performance Indicators | Targets | Actual Results |
|---|---|---|---|
| 1. Application of knowledge on impacts of climate change on health and adaptation measures by Canadian communities and individuals. | Increased application of heat alert and response systems (HARS) by Canadian communities, based on pilot heat alert and response systems established in 4 communities, and best practices guidelines. | Target: 5 new communities develop and implement heat alert and response system plans by 2016. | Five new partnerships agreements in support of the communities to develop and implement heat alert and response system plans were established in 2012-13 bringing the total number of communities working with HC to develop and implement HARS by 2016 to seven. |
Sub-Program 2.3.1 Narrative
By preparing Canadians for extreme heat events, Health Canada is strengthening Canada's adaptive capacity to reduce the health impacts of our changing climate. The target to develop and implement five heat alert and response systems plans by 2016 was exceeded with five new partnerships agreements established in 2012-13, bringing the total number of communities working with Health Canada to seven. Over the past year, Health Canada provided advice to, and helped to build local capacity among, public health and emergency management officials in several Canadian provinces, regions and communities on the most effective ways to respond to extreme heat events and protect people at risk. For example, at the request of the Province of Alberta, Health Canada participated in six working groups and presented Health Canada's heat research at four province-wide webinars. The department also worked with Ontario Health Units in an effort to harmonize HARS protocols across the province.
Over the past year, as a result of consultations and feedback from provincial level representatives, the program's work with the Meteorological Service of Canada (MSC) is providing more consistent heat-health warnings when Environment Canada issues its weather statements. A joint MSC - Health Canada working group was also established to explore consistent heat alert triggers across Canada.
The Health Canada accredited extreme heat and health e-learning course was launched in Fall 2012. The course is proving to be effective in training health practitioners on the effects of extreme heat.
Sub-Program Reporting 2.3.2 Air Quality
Sub-Program Description
This activity plays an important role in improving indoor and ambient air quality and protecting the health of Canadians through a broad range of activities. Research studies are conducted to determine what substances Canadians may be exposed to in their homes and from ambient air. Health risk assessments on these and other substances are carried out in order to develop indoor air quality guidelines and ambient air quality standards that are used by public health professionals and regulators to better manage air quality. Conventional fuels and their alternatives, as well as fuel emission management technologies, are assessed for any potential adverse impacts from their use or introduction into the Canadian marketplace. Economic research supports the development of cost-benefit analyses for proposed government options to control air pollution sources.
| Planned Spending 2012-13 |
Actual Spending 2012-13 |
Difference 2012-13 |
|---|---|---|
| 17.8 | 13.7 | 4.1 |
| Planned 2012-13 |
Actual 2012-13 |
Difference 2012-13 |
|---|---|---|
| 138 | 80 | 58 |
Notes: The variance between planned and actual FTE utilization is mainly due to delays in the staffing plan for the Clean Air Agenda program.
| Expected Results | Performance Indicators | Targets | Actual Results |
|---|---|---|---|
| 1. Incremental improvements in air quality and health benefits through improved risk management strategies (e.g. regulatory framework). | # of planned regulations, standards and guidelines developed in support of risk management strategies, leading to improvements in air quality.
# of planned risk management strategies incorporated in building codes, and communicated through targeted information products, thereby reducing risk to health. |
Target:
|
Six risk management strategies developed, including: two Canadian Ambient Air Quality Standards, two Indoor Guidelines, and two Communication activities.
The Canadian Council of Ministers of the Environment agreed to implement a new national Air Quality Management System (AQMS), which includes new Canadian Ambient Air Quality Standards (CAAQS) for particulate matter (PM) and ozone (O3). Residential Indoor Air Quality Guidelines for naphthalene and benzene were published for public comment in Canada Gazette, Part I. A final Residential Indoor Air Quality Guideline for fine particulate matter (PM) was also published. Indoor and outdoor air quality continued to be a main focus of communications activities through, for example, the Hazardcheck: Hazards in your home campaign, and the new Our Health, Our Environment: A Snapshot of Environmental Health in Canada. |
Sub-Program 2.3.2 Narrative
The air program successfully met targets set for providing health guidance to support actions to reduce the health risks posed by indoor and outdoor air pollutants.
The Canadian Council of Ministers of the Environment agreement to implement the new Air Quality Management System (AQMS) represents a major success of collaborative effort among federal and provincial governments and stakeholders over many years.
Significant actions supported by the air program's research and health risk assessments included establishing new residential indoor air quality guidelines and proposed new regulations by Environment Canada to reduce air emissions from transportation sources. Indoor and outdoor air quality also continued to be a main focus of Health Canada's communications activities, through the Hazardcheck campaign, regular release of social media messages, the new Our Health, Our Environment: A Snapshot of Environmental Health in Canada and increased availability of the Air Quality Health Index (AQHI) to Canadians, including a partnership with the Weather Network. New research on air quality and health was initiated, and results of completed studies were presented through more than fifty scientific publications and presentations.
Successful implementation of the air program requires collaboration among all levels of government, non-governmental organizations and industry. The early and continued engagement of stakeholders and partners is essential to ensuring efficient and effective actions to address air quality.
Sub-Program Reporting 2.3.3 Water Quality
Sub-Program Description
This activity develops guidelines for drinking water quality, which are used by all provinces and territories as the basis for establishing their regulatory requirements for drinking water quality. Guidelines for recreational water quality, and for household reclaimed water, are also developed, and collaboration is undertaken on standards for drinking water materials. Work is done in close collaboration with partners and stakeholders, research related to drinking water is directed and supported by this activity, and partnerships are forged with stakeholders to address key challenges to drinking water safety, including small community drinking water supplies.
| Planned Spending 2012-13 |
Actual Spending 2012-13 |
Difference 2012-13 |
|---|---|---|
| 3.4 | 3.6 | -0.2 |
| Planned 2012-13 |
Actual 2012-13 |
Difference 2012-13 |
|---|---|---|
| 25 | 31 | -6 |
| Expected Results | Performance Indicators | Targets | Actual Results |
|---|---|---|---|
| 1. Enhanced water quality knowledge / information to reduce risks to health of Canadians. | # of water quality guidelines / guidance documents approved by F/P/T Committees by:
|
Target: 5 guidelines/guidance documents approved by F/P/T Committees Annually. | 5 guidelines/guidance documents have been approved by the F/P/T Committee on Health and Environment.
These included:
|
Sub-Program 2.3.3 Narrative
In 2012-13, the water program continued to support drinking water programs nationally by providing expert advice through the development of five guidelines/guidance documents, which were approved by provinces and territories. This included the following documents: turbidity in drinking water, vinyl chloride in drinking water, waterborne bacterial pathogens in drinking water, guidance on the use of the microbiological drinking water quality guidelines and the Guidelines for Canadian Recreational Water Quality. Guideline development is dependent on on-going and extensive collaboration with provincial and territorial partners.
Sub-Program Reporting 2.3.4 Health Impacts of Chemicals
Sub-Program Description
Through this program, Health Canada cooperates with Environment Canada under the Canadian Environmental Protection Act, 1999 to assess and manage the potential risks posed by new and existing substances produced, imported or used in Canada. Health Canada activities include risk assessments of existing (post-market) substances and developing risk management strategies, policies and regulations for substances determined as harmful to human health, as a complement to Environment Canada's review of environmental impacts. Health Canada activities also include assessing and managing potential health risks associated with new (pre-market) substances and products of biotechnology that are about to enter the Canadian market. These activities reduce the health risks to Canadians posed by substances by identifying those that may be harmful and taking appropriate steps to reduce this risk. Health Canada's chemical management responsibilities further include acting as an Expert Support Department in helping to assess human health risks in contaminated site management (Federal Contaminated Sites Action Plan) and in development projects (Canadian Environmental Assessment Act).
| Planned Spending 2012-13 |
Actual Spending 2012-13 |
Difference 2012-13 |
|---|---|---|
| 89.5 | 80.8 | 8.7 |
Notes: Of the $89.5M difference between planned and actual spending, $6.3M was allocated to support Radiation Protection (PA 2.6). The remaining variance of $2.4M between planned and actual expenditures is mainly due to delays in the staffing plan for the Chemical Management Plan and the Clean Air Agenda programs.
| Planned 2012-13 |
Actual 2012-13 |
Difference 2012-13 |
|---|---|---|
| 666 | 528 | 138 |
Notes: Of the 138 FTE difference between planned and actual FTEs utilization, 41 FTEs were allocated to support Radiation Protection (PA 2.6). The remaining variance of 97 is mainly due to delays in the staffing plan for the Chemical Management Plan.
| Expected Results | Performance Indicators | Targets | Actual Results |
|---|---|---|---|
| 1. Timely Regulatory Response to chemical-related risks to health. | % of targets/service standards met for existing substances; for ‘In Commerce List' substances; and for new substances by:
(Note: the In Commerce List is a list of substances in products regulated under the Food and Drugs Act that were in in Canadian commerce between 01 January, 1987 and 13 September, 2001.) |
Target: 100% of targeted substances, 2011, ongoing. | 202 of the 227 (89%) planned assessments for 2012-13 completed. All (100%) new substance notifications received in 2012-13 were assessed.
A revision of the In Commerce List was completed. All 1,922 nominations received were reviewed bringing the total of substances on this list to approximately 3,400. New Substances: 100% of new substances suspected of being harmful to human health or the environment were risk managed which equates to 4% of all new substances notified. |
| 2. Measurable indications of minimized exposure of chemical substances in the Canadian population. | Level of exposure in humans of substances of concern by:
|
July 2010, 1st report completed August 16, 2010.
(Note: Based on Cycle 1 of the Canadian Health Measures Survey (CHMS), baseline levels in human blood for substances of concern were established for mercury, lead, cadmium and polybrominated diphenyl ethers (PBDE 47). CHMS Cycle 2 results (2009-2011) to be released in April 2013.) |
Based on Cycle 1 of the CHMS, baseline levels in human blood for substances of concern were established:
Targets to be determined based on established baseline data. |
Sub-Program 2.3.4 Narrative
Good progress was made towards the goal of assessing 1,500 remaining priority existing substances between 2011-12 and 2015-16, with the majority of the 2012-13 planned assessments completed. This includes a total of 83 substances assessed across the legacy, challenge and petroleum initiatives, of which 16 assessment reports were published on the chemical substances website. The remaining 67 assessed substances are on track to be published in 2013-14. In addition, rapid screening assessments were completed as planned; and targeted risk management activities were completed and published for challenge substances.
All new substance notifications received in 2012-13 were assessed and all new substances suspected of being harmful to human health or the environment were risk managed. Health Canada completed a revision of the In Commerce List (substances in products regulated under the Food and Drugs Act that were in Canadian commerce between 01 January 1987 and 13 September 2001). The department also completed 180 knowledge transfer activities (client meetings, reports, publications and presentations) in support of research and monitoring and surveillance activities for the Chemicals Management Plan.
Health Canada's environmental assessment program under the Canadian Environmental Assessment Act provided expert advice to ten panel processes last year. Health Canada also provided advice on 66 projects including hydroelectric, nuclear, transportation and mining projects.
Health Canada's contaminated sites program met all planned work objectives. The program published five guidance documents related to human health risk assessment at federal contaminated sites and provided training in this subject area to federal custodians managing contaminated sites.
Sub-Program Reporting 2.3.5 Public Health Inspections of Passenger Conveyances
Sub-Program Description
Through the Passenger Conveyances program activity, Health Canada provides the following services: inspections of food, water and general sanitation conditions on international/interprovincial cruise ships, passenger ferries, railways and their ancillary services (flight kitchens, train stations, etc.), airport facilities, and federal facilities serving the public; inspections of international vessels to prevent the introduction of communicable diseases into Canada; investigation reports and advisory services to prevent and control gastrointestinal diseases as requested by the industry or due to high incidence rates noted through surveillance activities; and general environmental and public health information and practices are provided to industries involved in the provision of food and potable water to ensure adequate knowledge of safety practices.
| Planned Spending 2012-13 |
Actual Spending 2012-13 |
Difference 2012-13 |
|---|---|---|
| 3.0 | 3.9 | -0.9 |
| Planned 2012-13 |
Actual 2012-13 |
Difference 2012-13 |
|---|---|---|
| 38 | 36 | 2 |
| Expected Results | Performance Indicators | Targets | Actual Results |
|---|---|---|---|
| 1. Public health risks associated with 'Passenger conveyances' and ancillary services are reduced. | # of Passenger conveyances meeting the standards outlined in HC Inspection Guidelines. | Target: 1000 -1200 passenger conveyances meeting the standards. | A total of 1,102 passenger conveyances were found to meet the standards outlined in the HC Inspection Guidelines.
This program moved to PHAC on April 1, 2013. |
| % of urgent public health events associated with passenger conveyances for which response(s) meet(s) the standards outlined in the Emergency Response protocols. | Target: 100% of responses to urgent events meet the Emergency Response protocols. | A total of 100 % of responses to urgent public health events met the Emergency Response protocols.
This program moved to PHAC on April 1, 2013. |
Sub-Program 2.3.5 Narrative
Health Canada continued to provide the conveyance industry with expert advice, public health inspections, audits, outreach activities and responses to urgent public health events. In 2012-13, Health Canada developed and implemented a risk-based approach to public health on passenger conveyances in Canada to better target resources to address the greatest public health risks to travellers in Canada. Work focused on the public health risks associated with water, food and sanitary conditions, and included 18 investigations of possible outbreaks associated with trains, ferries, cruise ships, aircraft and ancillary services, in addition to routine public health inspections and audits. This unit will be forwarded to PHAC 2013-14.
Program 2.4: Consumer Product Safety
Health Canada is committed to promoting the health and safety of Canadians by working to improve the safety of consumer products in the Canadian marketplace. Under the Consumer Product Safety Program, Health Canada works to identify, assess, manage and communicate to Canadians the health and safety risks associated with consumer products that adults and children commonly used for personal family, household or garden purposes, or in recreation or sports. This is achieved through areas of active prevention, targeted oversight and rapid response, all of which are supported by the Canada Consumer Product Safety Act.
Through active prevention, Health Canada works with industry to help proactively identify and systematically assess safety risks posed by consumer products, develop standards and share best practices. Also, the Program Activity promotes awareness of new policy and regulatory activity, and provides guidance to industry on existing regulations through guidance documents, workshops and training. Through targeted oversight, the program keeps a close watch on products for which the risks are not yet fully understood or that pose the greatest potential risk to the public. Under rapid response, Health Canada can act quickly to protect the public when a problem occurs - including the removal of unsafe consumer products from store shelves.
Through this Program Activity, Health Canada also helps to ensure that cosmetic products used by Canadians on a daily basis are safe and meet the requirements set out in the Food and Drugs Act and its Cosmetic Regulations. By prohibiting or restricting the use of certain ingredients in cosmetics and requiring ingredients to be listed on outer product labels, Canadians can make informed decisions when selecting and using cosmetics.
| Total Budgetary Expenditures (Main Estimates) 2012-13 |
Planned Spending 2012-13 |
Total Authorities (available for use) 2012-13 |
Actual Spending (authorities used) 2012-13 |
Difference 2012-13 |
|---|---|---|---|---|
| 33.4 | 33.4 | 29.8 | 28.1 | 5.3 |
Notes: Of the $5.3M difference between planned and actual spending, $2.6M was allocated to support Radiation Protection (PA 2.6). The remaining variance is $2.7M.
| Planned 2012-13 |
Actual 2012-13 |
Difference 2012-13 |
|---|---|---|
| 283 | 239 | 44 |
Notes: Of the 283 FTE difference between planned and actual FTEs utilization, 34 FTEs were allocated to support Radiation Protection (PA 2.6). The remaining variance is 10 FTEs.
| Expected Results | Performance Indicators | Targets | Actual Results |
|---|---|---|---|
| 1. Increased consumer/industry awareness of health risks and regulatory requirements related to consumer products. | % by target population aware of information related to consumer and product safety and related to exposure to consumer products by:
|
To be set after baseline is established by March 31, 2012.
(Note: Target currently being revised for reporting in 2013-14.) |
Level of awareness:
Dissemination mechanism/source(s) of information received/viewed:
Type of target group and number reached:
1,117 respondents completed the questionnaire. The completion rate was 9.3%. |
| 2. Responsive regulatory system for consumer products. | % of regulatory actions addressed within service standards (SS) and targets set (TS) by:
|
The Canada Consumer Product Safety Act (CCPSA), including the provision for mandatory incident reporting, did not come into force until June 20, 2011. The baseline will be established by early 2013.
(Note: 90 % of consumer product incident reports received are triaged within the performance standard of 3 calendar days. Service standards for other regulatory actions will be developed in 2013-14). |
Achieved 88 % performance against service standard in 2012-13 for mandatory incident reporting from industry and voluntary incident reporting from consumers. |
| 3. Improved industry compliance with product safety obligations. | % and # of non-compliant products identified through the cyclical enforcement plan (CEP) for which corrective action is taken.
The regulatory regime for the Consumer Products Safety Program is based on Post-Market Surveillance. The sampling for compliance is targeted to those product categories where there is a reasonable assumption of non-compliance (i.e. higher risk). Therefore, high rates of non-compliance are expected. This is an indicator that the risk-based sampling is effective. In order to measure industry compliance, requirements are tested according to a planned cycle. |
Corrective action taken on 100% of non-compliant products inspected identified through targeted cyclical enforcement plan. | 10 regulated product categories with hazards identified in the cyclical enforcement plan were completed.
Corrective action was taken on 100% of non-compliant products as identified through the targeted cyclical enforcement plan. Health Canada used social media to inform Canadians of the 29 advisories and 236 recalls issued for consumer products. |
Performance Analysis and Lessons Learned
Health Canada continued the implementation of the Canada Consumer Product Safety Act (CCPSA), which came into force on June 20, 2011. In 2012-13, policies and procedures were revised in accordance with the new Act. While extensive work was conducted in 2011-12 to inform industry of their obligations under the Act, Health Canada recognized that there was still a portion of industry, in particular Small and Medium Enterprises (SMEs), who were unaware of some of their obligations. In response, the department used webinars, factsheets, guides and awareness campaigns to raise industry's knowledge about their CCPSA obligations. Furthermore, a national industry workshop was held in March 2013.
Publications and campaigns also targeted consumers, with publications such as Is Your Child Safe-Playtime, Safety with Radar and Art Teachers Guide for Chemicals Safety; and campaigns on Toy Safety, Safe Kids Week - poison prevention, and Safe Sleep.
Internationally, in support of the North American Cooperative Engagement Framework, Health Canada engaged with the United States and Mexico to prepare for the Second North American Summit to be held in Ottawa in September 2013. The Framework supports greater cooperation and sharing of information on consumer products that could present a hazard to human health and safety.
Health Canada continued to implement the Globally Harmonized System of Classification and Labelling of Chemicals in support of reducing regulatory compliance burden, increasing protection of workplaces, and cooperating with major trading partners. This work is part of a commitment under the Joint Action Plan for the Canada-US Regulatory Cooperation Council.
In support of the Action Plan with China's Administration of Quality Supervision, Inspection and Quarantine, Health Canada completed the pilot for the Urgent Consultation Mechanism on lighters; exchanged information on testing and inspection; made presentations to Chinese manufacturers on Canadian consumer product safety requirements; and initiated plans for the Third Canada-China consumer product safety high level dialogue meeting.
In October 2012, the department supported the launch of the OECD Global Recalls portal, which aggregates product recall information from various countries.
Health Canada continued to implement the Food and Consumer Safety Action Plan. Key highlights included the development of a strategic policy framework for the consistent application of risk assessment of consumer products; the expansion of the triage prioritization tool to reduce electrical hazards; proposed revisions to the mandatory reporting guidance; and cyclical enforcement.
Program 2.5: Substance Use and Abuse
Through regulatory, programming and educational activities, Health Canada seeks to improve health outcomes by reducing and preventing tobacco consumption and combating alcohol and drug abuse. Through the Tobacco Act and its regulations, Health Canada regulates the manufacture, sale, labelling, and promotion of tobacco products. It also leads the Federal Tobacco Control Strategy- the goal of which is to further reduce the prevalence of smoking through regulatory, programming and educational activities. Through the Controlled Drugs and Substances Act(CDSA) and its regulations, Health Canada regulates controlled substances and supports prevention, health promotion and treatment initiatives with the goal of reducing substance use and abuse and its associated harms.It also provides expert advice and drug analysis services to law enforcement agencies across the country.
| Total Budgetary Expenditures (Main Estimates) 2012-13 |
Planned Spending 2012-13 |
Total Authorities (available for use) 2012-13 |
Actual Spending (authorities used) 2012-13 |
Difference 2012-13 |
|---|---|---|---|---|
| 131.0 | 131.0 | 124.0 | 115.5 | 15.5 |
| Planned 2012-13 |
Actual 2012-13 |
Difference 2012-13 |
|---|---|---|
| 430 | 431 | -1 |
| Expected Results | Performance Indicators | Targets | Actual Results |
|---|---|---|---|
| 1. Declining levels of substance use and substance abuse. | Rates of substance use and abuse:
(Note: Revised indicator - % of current Canadians (15+) who use tobacco.) |
12% (Canadians 15+); 9% (youth (15-17).
(Note: Revised Target-Reduction in the prevalence of Canadians (15+) who smoke from base-year level of 17 %.) |
17.3% (Canadians 15+); in 2011 (2012 data release in October 2013).
7.7% (Youth smokers (15-17) in 2011 (2012 data release in October 2013). |
Levels of drug abuse in Canada:
|
Targets were not established under the PMF for 2012-13. Targets have been revised for 2013-14. | Results from CADUMS 2012:
|
|
| 2. Increased Compliance/ Adherence to Tobacco Act and Regulations, and Controlled Drugs and Substances Act and Regulation. | % of inspections that are compliant (C)/ non-compliant (NC) with acts, regulations, or other control instruments by:
|
100% of inspections are compliant with the acts, regulations, or other control instruments by:
|
84% compliance with the Tobacco Act at retail.
98% compliance for controlled substances instruments. |
Performance Analysis and Lessons Learned
Health Canada has continued to make progress on priorities related to tobacco control and the prevention of alcohol and drugs abuse.
The policy authority of the Federal Tobacco Control Strategy (FTCS) was renewed through Budget 2012. With smoking rates at their lowest levels, the renewed tobacco program works within the federal government's areas of core responsibility, and concentrates on populations with the highest rates of smoking. In response to recommendations of the Federal Tobacco Control Strategy 2001-2011 Horizontal Evaluation, Health Canada began to identify lessons learned from grants and contributions funded under the FTCS from 2007 - 2012 and to develop a performance measurement strategy for the refocused FTCS.
In addition to the Cracking Down on Tobacco Marketing Aimed at Youth Act, Health Canada continued to implement new labelling requirements for cigarettes and little cigars. Although smoking rates have remained relatively stable in the last three years, youth smoking has declined to an all-time low of 7.7%.
The department also conducted a significant number of Tobacco Act compliance promotion and enforcement activities at the retail level. The retail compliance rate increased from 77% in June 2012 (when the regulations came into force) to 84% (at year end 2012-13). Non-compliance at retail dealt primarily with selling products using the old labelling requirements.
Health Canada worked with the Department of Justice and other partners under the National Anti-Drug Strategy (NADS) to advance the prevention, treatment and enforcement of illicit drug use. It carried out a number of promotion and liaison activities with the Royal Canadian Mounted Police (RCMP), la Sûreté du Québec, provincial regulatory bodies and colleges who regulate pharmacists. The department provided training to Canada Border Services Agency officers on the identification of shipments that cannot be legally imported into Canada, and training and scientific knowledge to law enforcement officers on illicit drugs, precursor chemicals and safety in dismantling clandestine labs.
Under the enforcement action plan of the NADS, Health Canada conducted extensive follow-up work and targeted inspections of regulated parties and responded to high-risk situations stemming from emerging issues, loss and theft reports, and reported suspicious transactions. Furthermore, the department analyzed seized materials; helped with investigations and the safe dismantling of clandestine laboratories; and provided expert testimony in court.
Sub-Program Reporting 2.5.1 Tobacco
Sub-Program Description
The Tobacco program activities are aimed at reducing death and disease associated with tobacco use in Canada. Through the Tobacco Act and its regulations, Health Canada regulates the manufacture, sale, labelling, and promotion of tobacco products. It also leads the Federal Tobacco Control Strategy (FTCS) - the goal of which is to further reduce the prevalence of smoking through regulatory, programming, educational and enforcement activities.
| Planned Spending 2012-13 |
Actual Spending 2012-13 |
Difference 2012-13 |
|---|---|---|
| 57.1 | 28.2 | 28.9 |
Notes: The variance between planned and actual spending is due to the net effect of having achieved savings through simplifying and streamlining operations to focus on high risk populations while maintaining regulatory activity and reductions in litigation costs and delays in implementing the renewed Federal Tobacco Control Strategy (FTCS).
| Planned 2012-13 |
Actual 2012-13 |
Difference 2012-13 |
|---|---|---|
| 169 | 132 | 37 |
Notes: The variance between planned and actual FTE utilization is due to the net effect of savings achieved through simplifying and streamlining operations to focus on high risk populations while maintaining regulatory activity and delays in implementing the FTCS. Most reductions in FTEs were achieved through attrition and voluntary departures.
| Expected Results | Performance Indicators | Targets | Actual Results |
|---|---|---|---|
| 1. Declining levels of tobacco use. |
(Note: Revised Indicator - % of current Canadians (15+) who use tobacco.) |
Target:
(Note: Revised Target - Reduction in the prevalence of Canadians (15+) who smoke from base-year level of 17 %.) |
17.3% (Canadians 15+); in 2011 (2012 data release on October 2013).
7.7% (Youth smokers (15-17) in 2011 (2012 data release in October 2013). |
| 2. Industry compliance with Acts, Regulations and other control instruments related to tobacco. | % compliance:
|
Target: 100% compliance.
(Note: Revised target - 95% compliance). |
84 % compliance with the Tobacco Act at Retail, all provisions and regulations, except sales to youth. |
Sub-Program 2.5.1 Narrative
In 2012-13, Health Canada continued to conduct policy and regulatory research and analysis, develop recommendations, and monitored emerging issues in tobacco control. The FTCS is led by Health Canada in partnership with Public Safety, the Royal Canadian Mounted Police, Canada Revenue Agency, Canada Border Services Agency, the Public Health Agency of Canada and the Public Prosecution Services of Canada.
Few other countries have been as successful as Canada in lowering smoking rates and shifting public attitudes about tobacco. Smoking prevalence is now at its lowest-ever overall rate. As of 2011, 17% of Canadians were current smokers, down from 22% in 2001. Further, the prevalence rate for teens aged 15-17 is 8%. Working in its core area of responsibility, and building on past activities, the federal government has refocused the 2012-17 Strategy to concentrate on two groups with higher rates of smoking than most Canadians - on-reserve First Nations and Inuit people and young adults.
As part of the renewed FTCS, Health Canada implemented the Tobacco Products Labelling Regulations (Cigarettes and Little Cigars) for manufacturers, importers and retailers. New Health Warning Messages, which include the Pan-Canadian Quitline number and web portal, began appearing on cigarette and little cigar packages in early 2012. Health Canada also provided funding to provinces and territories to support the implementation of the Pan-Canadian Quitline number and web portal.
The department released the results of the Youth Smoking Survey in May 2012 and the Canadian Tobacco Use Monitoring Survey (CTUMS) in September 2012. In 2012-13, Health Canada developed and launched the new Canadian Tobacco Alcohol and Drugs Survey (CTADS). This biennial survey will replace CTUMS and the Canadian Alcohol and Drug Use Monitoring Survey (CADUMS).
Health Canada supported the successful defence of Canada in the $27B Blais and Létourneau class actions. This included the identification and collection of a large number of tobacco related documents in the care of the department, as part of one of the largest discovery processes in the Government of Canada's history. In light of the decision of the Supreme Court of Canada in July 2011, the Quebec court of Appeal dismissed tobacco company claims against the government of Canada on November 14, 2012.
Health Canada oversaw international obligations relating to tobacco control and fulfilled reporting requirements under international conventions. In November 2012, Health Canada led the Canadian delegation to the 5th session of the Conference of the Parties as part of Canada's commitments to the World Health Organization Framework Convention on Tobacco Control.
In 2012-13, the department distributed over 94,000 publications and responded to over 1,300 public enquiries on tobacco issues.
Sub-Program Reporting 2.5.2 Controlled Substances
Sub-Program Description
Health Canada administers the Controlled Drugs and Substances Act (CDSA) and its regulations. Health Canada regulates controlled substances and supports education, prevention, health promotion and treatment initiatives with the goal of reducing substance use and abuse and its associated harms. It also provides expert advice and drug analysis services to law enforcement agencies across the country.
| Planned Spending 2012-13 |
Actual Spending 2012-13 |
Difference 2012-13 |
|---|---|---|
| 73.9 | 87.3 | -13.4 |
Notes: The variance between planned and actual spending is due to increased demand under the Marihuana Medical Access Program.
| Planned 2012-13 |
Actual 2012-13 |
Difference 2012-13 |
|---|---|---|
| 262 | 297 | -35 |
Notes: The variance between planned and actual FTE utilization is primarily due to increased demand under the Marihuana Medical Access Program.
| Expected Results | Performance Indicators | Targets | Actual Results |
|---|---|---|---|
| 1. Declining levels of drug use. | Levels of drug abuse in Canada.
(Note: ‘Prevalence and Number of Canadians abusing controlled substances/licit drugs overall' refers to: i) compliance levels/ability to keep Precursor Chemicals out of the illicit drug market, and ii) pharmaceutical use/abuse.) |
Targets were not established under these indicators for the PMF for 2012/13. Targets have been revised for 2013/14. | Results from Canadian Alcohol and Drug Use Monitoring Survey (CADUMS) 2012:
|
| 2. Increased awareness of negative health effects of illicit drugs. | Level of general awareness and knowledge among target populations post-intervention. | Target: Higher than baseline levels - To be discussed with Public Affairs and Communications Branch (PACBB) for 2013-14 PMF renewal.
(Note: The federal mass media campaign that included activities to raise awareness regarding the risks of illicit drug use, sunset in March 2012. No targets and performance indicators were developed at the federal level for 2012-13.) |
Public Opinion Research for Controlled Substances Awareness was not undertaken in 2012-13 to assess the levels awareness of the negative health effects of illicit drugs as the media campaign sunsetted in March 2012 and no funding was available. |
| 3. Industry compliance with Acts, Regulations and other control instruments related to controlled substances. | % compliance:
|
Target: 100% compliance with controlled substances instruments.
(Note: Target revised - 95% compliance with controlled substances instruments.) |
98% compliant. |
Sub-Program 2.5.2 Narrative
Health Canada published the proposed Marihuana for Medical Purposes Regulations in Canada Gazette, Part I on December 15, 2012. The proposed regulations would return Health Canada to its traditional role of regulator and strike a balance between maintaining access and mitigating risks to public health, safety and security. In 2012-13, despite increasing demand, Health Canada met or exceeded established service standards set out for the current Marihuana Medical Access Program.
Health Canada coordinated Government of Canada preparations for the 2012 United Nations Commission on Narcotic Drugs meeting including working with partners to develop a resolution on prescription drug take back days. The department participated in the Inter-American Drug Abuse Control regular sessions and completed several reporting requirements including the United Nations Annual Report Questionnaire.
Health Canada continued its ongoing policy analysis and development related to controlled substance issues. For example, the department conducted analysis of the implications for federal policy and programs of the Supreme Court of Canada decision regarding Insite.
In addition, as of November 26, 2012, Health Canada has applied new licensing conditions to all licensed dealers carrying out activities with controlled release oxycodone products, such as Oxycontin and its generic formulations. Health Canada also developed a risk-based approach to compliance and enforcement activities of regulated parties under the Controlled Drugs and Substances Act and its regulations; and promulgated the New Classes of Practitioners regulations. In addition, three substances found in stimulant-type designer drugs were added to the schedules of the CDSA. Their scheduling under CDSA means that activities such as importation, possession, production and sale/provision are prohibited unless authorized by regulation or through a section 56 exemption, thus helping to minimize diversion to an illicit market or use.
Program 2.6: Radiation Protection
Health Canada aims to reduce the health and safety risks associated with different types of radiation, both naturally occurring and from artificial sources, in living and working environments. Health Canada conducts research into the biological effects of environmental and occupational radiation, develops better methods for internal radiation dosimetry and its measurement, provides radiation safety inspections of federally regulated facilities containing radiation-emitting devices, develops regulations, guidelines, standards and safety codes pertaining to radiation-emitting devices, and provides radiation advice to other government departments, industry and the general public.
| Total Budgetary Expenditures (Main Estimates) 2012-13 |
Planned Spending 2012-13 |
Total Authorities (available for use) 2012-13 |
Actual Spending (authorities used) 2012-13 |
Difference 2012-13 |
|---|---|---|---|---|
| 7.4 | 7.4 | 15.4 | 15.3 | -7.9 |
Notes: An additional $8.8M was allocated to this program from Environmental Risks to Health (PA 2.3) and Consumer Product Safety (PA 2.4). The remaining variance is $0.9M.
| Planned 2012-13 |
Actual 2012-13 |
Difference 2012-13 |
|---|---|---|
| 100 | 163 | -63 |
Notes: An additional 75 FTE were allocated to this program from Environmental Risks to Health (PA 2.3) and Consumer Product Safety (PA 2.4). The remaining variance is 12 FTEs.
| Expected Results | Performance Indicators | Targets | Actual Results |
|---|---|---|---|
| 1. Increased public/stakeholder awareness of health risks related to radiation/radon. | % and # of Canadians aware or knowledgeable of information and health risks related to radiation/radon by:
|
30% of Canadians. | 65 % of Canadian homeowners are aware of radon.
(Note: Public opinion research was conducted in January 2013 to February 2013 to obtain insights into the knowledge, awareness, attitudes and behaviours of Canadians regarding radon.) |
| 2. Increased compliance/ adherence to radiation emitting devices acts and regulations, and Canadian Nuclear Safety Commission acts and regulations. | % of inspected registrants/firms/users that are compliant/non-compliant with acts, regulations, or other control instruments by:
|
At least 75% of inspected devices are compliant with the acts, regulations, or other control instruments by:
|
100% of requests for inspections / assessments related to enforcement of Radiation Emitting Devices Act and regulations completed. |
| 3. Declining Level of Illnesses and Injuries from 'Exposure to Radiation in the Environment'. | Incidence/rate of illness/risk related to exposure to radiation in the environment by:
|
Baseline to be established by March 31, 2012.
(Note: No baseline was established. Indicator has been revised for 2013-14 reporting.) |
The performance indicator has been revised for 2013-14 reporting. |
Performance Analysis and Lessons Learned
Health Canada continued its work to reduce risks associated with radiation emitting devices, to increase Canadians' awareness and understanding of risks related to these devices, and to meet national and international requirements related to environmental radiation monitoring. In January 2013, Health Canada conducted public opinion research to assess the level of knowledge, awareness, attitudes and behaviours of Canadians regarding radon and found that 65% of Canadian homeowners are aware of radon.
Health Canada led 94 outreach and engagement activities on the health risks of radon and responded to more than 1,000 public inquiries associated with radiation emitting devices, with over 600 information requests on the potential health effects of electric and magnetic fields, ultraviolet, infrared and visible light radiation and acoustics from consumer devices and manmade environmental sources.
Health Canada increased awareness on the risks, health impacts and mitigation strategies related to indoor radon exposure. Its radon pro-active media campaign to raise radon awareness related to risks, health impacts and mitigations strategies resulted in an increase in national media pick up and coverage in 2012-13 compared to the previous year. The collaborative processes between the federal government and a wide range of stakeholders contributed to the campaign's success.
The radon brochure distribution increased by 100%, visits to the radon web pages increased by over 100% and radon public inquiries increased by 43%, compared to 2011-12. Health Canada also published two new radon videos: Radon Testing - The Only Way to Know and Reducing Radon in your Home.
The department continued testing radon levels in federal buildings in high-risk, radon-prone areas. In 2012-13, Health Canada prepared 20,000 radon detectors and tested 2,600 federal buildings for radon.
FSDS Performance Summary
In support of the Federal Sustainable Development Strategy (FSDS) and the Clean Air Agenda (CAA), Health Canada tested radon levels in approximately 2,600 high priority federal buildings in high-risk, radon-prone areas in 2012-2013. Since the start of the program in 2007, 12,000 high priority buildings have been tested for radon. In support of the National Radon Awareness Campaign, a radon proactive media relations campaign was successfully executed resulting in an increase in national media pick up and coverage in 2012-13 compared to the previous year. Radon brochure distribution increased by 100%, visits to the radon web pages increased by over 100% and radon public inquiries increased by 43% as compared to 2011-12. Health Canada also published two new radon videos: Radon Testing- The Only Way to Know and Reducing Radon in your Home.
Sub-Program Reporting 2.6.1 Environmental Radiation Monitoring and Protection
Sub-Program Description
Health Canada assesses and manages the health risks associated with solar UV radiation, environmental electromagnetic frequencies, environmental noise, radon, and other naturally occurring sources of radiation as well as technological sources of radioactivity. This program's activities include: monitoring of environmental radiation through the Canadian Radiological Monitoring Network; installation and operation of 15 monitoring stations across Canada to provide data to the Comprehensive Nuclear-Test-Ban Treaty Organization to monitor for evidence of any nuclear explosion; and taking regulatory actions to address environmental radiation that poses a risk to public health.
| Planned Spending 2012-13 |
Actual Spending 2012-13 |
Difference 2012-13 |
|---|---|---|
| 3.5 | 9.4 | -5.9 |
Notes: An additional $4.4M was allocated to this program from Environmental Risks to Health (PA 2.3) and Consumer Product Safety (PA 2.4). The remaining variance is minus $1.5M.
| Planned 2012-13 |
Actual 2012-13 |
Difference 2012-13 |
|---|---|---|
| 22 | 58 | -36 |
Notes: An additional 40 FTEs were allocated to this program from Environmental Risks to Health (PA 2.3) and Consumer Product Safety (PA 2.4). The remaining variance is 4 FTEs.
| Expected Results | Performance Indicators | Targets | Actual Results |
|---|---|---|---|
| 1. Increased testing of Government of Canada ‘priority buildings' (based on risk assessments) for radon levels. | % of Government of Canada 'priority buildings' that are tested for radon levels. | Target: 50% of priority Federal Buildings are tested.
(Note: Target for 2012-13 2,000 Government of Canada 'priority buildings' tested in 2012-13.) |
Since the start of the program in 2007, 12,000 high priority Federal buildings have been tested for radon.
In 2012-13 2,600 federal buildings were tested or 30% more than targeted. |
| 2. Increased adherence with international and national requirements related to environmental radiation monitoring. | % adherence to international and national environmental radiation monitoring requirements. | Target:
|
|
| 3. Improved awareness of risks, health impacts and mitigation strategies related to indoor radon exposure. | # of hits on HC Radon webpage. # of downloads of Radon: A Guide for Canadian Homeowners. # of public inquiries. # of brochures and fact sheets ordered. |
Target: 10% increase in hits and downloads over each previous year. | Over 100% increase in page views to the radon web pages (102,123 page views). Radon: A Guide for Canadian Homeowners was discontinued by the Canada Mortgage and Housing Corporation in 2012-13. 43% increase in public inquiries (1,022 public inquires). 100% increase in radon brochure distribution (920,000+ radon brochures and factsheets distributed). |
Sub-Program 2.6.1 Narrative
Health Canada met national and international requirements related to environmental radiation monitoring under the Comprehensive Nuclear Test Ban Treaty. The department tested radon levels in 2,600 federal buildings in 2012-13. Since the start of the program in 2007, Health Canada has tested 12,000 federal buildings for radon. A National Radon Awareness Campaign was conducted raising awareness related to radon risks, health impacts and mitigation strategies. The proactive media relations campaign resulted in an increase in national media pick up and coverage in 2012-13 over the previous year.
Sub-Program Reporting 2.6.2 Radiation Emitting Devices
Sub-Program Description
Health Canada is responsible for the administration and enforcement of the Radiation Emitting Devices Act. Under the Radiation Emitting Devices program activity, Health Canada assesses monitors and assists in the reduction of the health and safety risks associated with radiation-emitting devices (e.g. X-rays, microwaves, lasers) by, for example, promoting consumer awareness of the risks of exposure to certain types of radiation. Health Canada also conducts research into the biological effects of radiation, develops guidelines, standards and safety codes and provides radiation safety inspections of facilities containing radiation-emitting devices. The program also provides expert advice on radiation to other Health Canada programs, federal departments and provincial authorities so that they may fulfil their legislative mandates.
| Planned Spending 2012-13 |
Actual Spending 2012-13 |
Difference 2012-13 |
|---|---|---|
| 3.2 | 4.1 | -0.9 |
Notes: An additional $4.4M was allocated to the program from Environmental Risks to Health (PA 2.3) and Consumer Product Safety (PA 2.4). The remaining variance is $3.5M.
| Planned 2012-13 |
Actual 2012-13 |
Difference 2012-13 |
|---|---|---|
| 16 | 33 | -17 |
Notes: An additional 35 FTEs were allocated to this program from Environmental Risks to Health (PA 2.3) and Consumer Product Safety (PA 2.4). The remaining variance is 18 FTEs.
| Expected Results | Performance Indicators | Targets | Actual Results |
|---|---|---|---|
| 1. Increased knowledge/ research/ evidence to support decision-making regarding the development and amendment of regulations, guidelines, standards and safety codes of Radiation Emitting Devices. | # of research studies conducted in support of health effects of exposure to radiation emitting devices by:
|
Target: Completion and/or progress made towards an average of 2 projects per area as determined by Internal Review Board and transfer of knowledge. 1 other radiation project under Chemical, Biological, Radiological Nuclear Research and Technology Initiative (CRTI) Progress made towards It's Your Health online publication. | Average of 2 projects per area of focus (ionizing radiation, electromagnetic radiation, UV, noise) completed.
Research studies by area of focus:
2 “It's Your Health” publications on HC website. |
| 2. Increased awareness and understanding of risks related to consumer and clinical radiation emitting devices by Canadians. | # of hits to the Consumer and Clinical Radiation Protection (CCRP) related web pages by:
# of Inquiries to the CCRP Bureau by:
|
Target: Baseline to be established by March 31, 2013.
(Note: No baseline established; strategy is currently under review.) |
47,384 hits on the CCRP webpage:
1,003 public inquiries of which over 600 information requests were regarding potential health effects on EMF/ UV/IR/Visible light and Acoustics from consumer devices and manmade environmental sources. Most of these inquiries were related to EMF (cell towers, smart meters, WiFi) or wind turbine noise. |
Sub-Program 2.6.2 Narrative
This sub-program continued to meet all its expected results in 2012-13. In support of increasing Canadians' awareness and understanding of risks related to radiation emitting devices, Health Canada posted two “It's Your Health” (IYH) publications on its website (IYH Powerlines, IYH Noise Induced Hearing Loss) and posted two advisories on the Healthy Canadians website (Laser Advisory and Noisy Toys Advisory). The department continued to conduct research studies on the health effects of exposure to radiation emitting devices and responded to over 1,000 public enquiries relating to the potential health effects of electric and magnetic fields, ultraviolet, infrared and visible light radiation and acoustics from consumer devices and manmade environmental sources.
Sub-Program Reporting 2.6.3 Dosimetry Services
Sub-Program Description
This program activity includes Health Canada's National Dosimetry Services (NDS), National Dose Registry (NDR) and National Calibration Reference Centre (NCRC). NDS provides services on a cost-recovery basis to monitor and report on occupational radiation exposure. NDS also collects data to help improve workplace practices and safety standards and to educate Canadians on issues of exposure to radiation in the workplace. NDR is a centralized radiation dose record system that contains dose records of all monitored radiation workers in Canada. The NDR functions to: notify regulatory authorities of overexposures within their jurisdiction; provide dose histories to individual workers and organizations for work planning and for compensation and litigation cases; evaluate dose trends and statistics to answer requests from regulators and others and to compile into reports and conduct health research. NCRC for Bioassay and In Vivo Monitoring provides high quality intercomparison programs to validate measurement of internal ionizing radiation exposure of workers to help ensure that measurements are accurate.
| Planned Spending 2012-13 |
Actual Spending 2012-13 |
Difference 2012-13 |
|---|---|---|
| 0.7 | 1.8 | -1.1 |
| Planned 2012-13 |
Actual 2012-13 |
Difference 2012-13 |
|---|---|---|
| 62 | 72 | -10 |
| Expected Results | Performance Indicators | Targets | Actual Results |
|---|---|---|---|
| 1. Efficiency of dosimetry services. | % of dosimetry service standards met for (i) radiation dose reports (ii) client requests (iii) client satisfaction.
(Note: The Dosimetry Service is not a regulatory activity, therefore 'by regulatory action taken' and 'by result of regulatory action' is not relevant. The Canadian Nuclear Safety Commission is responsible for regulatory aspect. Health Canada provides a service on a cost-recovery basis to read personal dosimeters for radiation exposure data. Health Canada maintains a radiation dose records system in order to answer questions from individual workers, organizations and regulatory authorities, as well as for statistical trending purposes.) |
Target:
|
91% of client dosimeter readings were reported and sent to the National Dose Registry and to clients within 10 days of receipt. 95% of the 26,600 client requests were processed within 2 days of receipt. Client questionnaires show high rate of satisfaction (91% of respondents) with NDS' products and services. |
Sub-Program 2.6.3 Narrative
Health Canada provided timely and reliable dosimetry services to 12,455 client groups. The department processed and reported 91% of dosimeter readings to client groups and the NDR within 10 days of receipt. Of the 50,000 client transactions in the NDR, more than 49,500 transactions were addressed without issue and less than one percent were identified as client complaints. The introduction of NDS process improvements reduced the complaint rate.
Program 2.7: Pesticide Safety
Health Canada, through the Pest Management Regulatory Agency, administers the Pest Control Products Act (PCPA) and its regulations. The primary objective of the PCPA is to prevent unacceptable risks to people and the environment from the use of pest control products. Health Canada regulates the entire life cycle of a pesticide, including: determination of value, health and environmental risk assessment, characterization and mitigation, registration of products, monitoring and enforcement activities, re-evaluation of registered pesticides on a 15-year cycle, and phase-out or cancellation of products. Pest control products are regulated in a manner to encourage the development and implementation of innovative, sustainable pest management strategies and to facilitate access to pest control products that pose lower risks. Health Canada also encourages public awareness in relation to pest control products by informing the public, facilitating access to relevant information and participating in the decision-making process. Health Canada plays a leading role in international efforts to integrate various regulatory systems around the world. International cooperation facilitates consistency and ensures the best science available supports our decision making.
| Total Budgetary Expenditures (Main Estimates) 2012-13 |
Planned Spending 2012-13 |
Total Authorities (available for use) 2012-13 |
Actual Spending (authorities used) 2012-13 |
Difference 2012-13 |
|---|---|---|---|---|
| 39.0 | 39.0 | 45.1 | 42.1 | -3.1 |
Notes: The increase of $6.1M between planned spending and total authorities is mainly due to funding received to improve access to minor-use and reduced-risk pesticides. The variance between authorities and actual spending of $3.1M is due to extra revenues received over the planned amount, and new funds received late in the operating cycle.
| Planned 2012-13 |
Actual 2012-13 |
Difference 2012-13 |
|---|---|---|
| 533 | 430 | 103 |
Notes: The variance between planned and actual FTE utilization is mainly due to a reduction in staff as a result of savings achieved through simplifying and streamlining operations (which did not impact service delivery). Most reductions in FTEs were achieved through attrition and voluntary departures.
| Expected Results | Performance Indicators | Targets | Actual Results |
|---|---|---|---|
| 1. Prevention of unacceptable risk from pesticides. | As a result of regulatory decisions:
|
Annually
(Note: The target "Annually" refers to the quantitative measure of the related Performance Indicator. Starting April 1, 2013, as per the new PMF, targets have been revised to a % of activities completed for the respective performance indicator.) |
Decisions were finalized or proposed on 389 pesticide active ingredients of the 401 under re-evaluation (97%). Of those:
|
| 2. Timely regulatory decisions for pesticides. | % of reviews conducted within service standards and targets set for:
|
|
Category A: 98%; Category B: 93%; Category C: 91%.
|
| 3. Mitigation of risks of/from non-compliance associated with pesticides. | # and % of registrants/vendors/users, within a sector, found to be non-compliant that have returned to compliance (i.e., risks are mitigated) by:
|
90% return to compliance. |
|
Performance Analysis and Lessons Learned
Health Canada continued to deliver on its Pesticide Safety program responsibilities, under the Pest Control Products Act, through the evaluation and re-evaluation of pesticide products, as well as compliance, enforcement and risk reduction strategies. In order to address the economic environment, process and administrative efficiencies were implemented in the approaches that support the overall commitment to modernizing pesticide safety. As well, Health Canada made a total of 3,154 regulatory decisions on various categories of pesticide submissions, representing an 18% increase from last year.
Health Canada's continued international collaboration with our partners further contributed to finding efficiencies and standardizing global approaches. Accordingly, significant progress was made in the past year with increased projects involving collaboration with international organizations such as OECD, NAFTA and World Health Organization. For example, Health Canada successfully coordinated the establishment of an OECD Network of Government Officials for Pesticide Compliance and Enforcement, completed a key NAFTA Project on the Harmonization of Groundwater Modelling, and partnered with the United States on the development and publication of a pollinator risk assessment framework.
The implementation of the Food and Consumer Safety Action Plan continued to be a success with all Year 5 commitments being met. Funding under the Plan enabled PMRA to deliver compliance programs and projects during this reporting period. Significant active prevention and inspection activities were conducted for key sectors. Several outreach materials were disseminated to the public to increase pesticide safety awareness.
Streamlined processes and increased international collaboration contributed to finding efficiencies and standardizing global approaches. As well, knowledge transfer and experience were deemed important factors for the successful implementation of best practices across the Pesticide Safety Program activities.
Strategic Outcome 3: First Nations and Inuit communities and individuals receive health services and benefits that are responsive to their needs so as to improve their health status
This Strategic Outcome seeks to ensure that First Nations and Inuit living on reserve or in Inuit communities have access to health services as well as a limited range of medically necessary health-related goods and services not provided through private insurance plans, provincial/territorial health or social programs or other publicly funded programs. It seeks to reduce the gap in health outcomes between First Nations and Inuit and the Canadian population in general.
Program 3.1: First Nations and Inuit Primary Health Care
Sub-Programs and Sub-sub Programs:
3.1.1: First Nations and Inuit Health Promotion and Disease Prevention
- 3.1.1.1 First Nations and Inuit Healthy Child Development
- 3.1.1.2 First Nations and Inuit Mental Wellness
- 3.1.1.3 First Nations and Inuit Healthy Living
3.1.2 First Nations and Inuit Public Health Protection
- 3.1.2.1 First Nations and Inuit Communicable Disease Control and Management
- 3.1.2.2 First Nations and Inuit Environmental Health
3.1.3 First Nations and Inuit Primary Care
- 3.1.3.1 First Nations and Inuit Clinical and Client Care
- 3.1.3.2 First Nations and Inuit Home and Community Care
Program 3.2: Supplementary Health Benefits for First Nations and Inuit
Program 3.3: Health Infrastructure Support for First Nations and Inuit
Sub-Programs and Sub-sub Programs:
3.3.1 First Nations and Inuit Health System Capacity
- 3.3.1.1 First Nations and Inuit Health Planning and Quality Management
- 3.3.1.2 First Nations and Inuit Health Human Resources
- 3.3.1.3 First Nations and Inuit Health Facilities
3.3.2 First Nations and Inuit Health System Transformation
- 3.3.2.1 First Nations and Inuit Systems Integration
- 3.3.2.2 First Nations and Inuit e-Health Infostructure
- 3.3.2.3 First Nations and Inuit Nursing Innovation
Program 3.1: First Nations and Inuit Primary Health Care
The Primary Health Care Activity funds a suite of programs, services and strategies provided primarily to First Nations and Inuit individuals, families and communities living on-reserve or in Inuit communities. It encompasses health promotion and disease prevention programs to improve health outcomes and reduce health risks, public health protection, including surveillance, to prevent and/or mitigate human health risks associated with communicable diseases and exposure to environmental hazards, and primary care where individuals are provided diagnostic, curative, rehabilitative, supportive, palliative/end-of-life care and referral services.
| Total Budgetary Expenditures (Main Estimates) 2012-13 |
Planned Spending 2012-13 |
Total Authorities (available for use) 2012-13 |
Actual Spending (authorities used) 2012-13 |
Difference 2012-13 |
|---|---|---|---|---|
| 891.7 | 891.7 | 955.3 | 981.0 | -89.3 |
Notes: The increase of $63.6M between planned spending and total authorities is due to funding received for First Nations and Inuit Primary Health Care programs through Supplementary Estimates. The variance of $25.7M between total authorities and actual spending was covered through reallocations of funding from the other program activities within this strategic outcome.
| Planned 2012-13 |
Actual 2012-13 |
Difference 2012-13 |
|---|---|---|
| 1,222 | 1,593 | -371 |
Notes: The variance between planned and actual FTE utilization is mainly due to the net effect of increases in program funding and related staffing for Indian Residential Schools, the Water and Waste Water action plan and Clinical and Client Care Nursing Services. These were offset by decreases to the base FTEs as a result of savings achieved through simplifying and streamlining operations which did not impact service delivery to First Nations and Inuit.
| Expected Results | Performance Indicators | Targets | Actual Results |
|---|---|---|---|
| 1. Primary health care programs and services that are responsive to the needs of First Nations and Inuit individuals, families and communities. | Immunization coverage rates for two and seven year old children living on-reserve. | 95% of all provincially scheduled childhood immunizations. | While 2012-13 data is not yet available, progress continued toward the March 31, 2016, target of 95% coverage for provincially supported vaccines among two and seven year olds living on-reserve. |
| % of on-reserve population receiving required primary care assessment/ diagnostic, treatment, rehabilitative, supportive and palliative care services. | Maintain service levels of 2010-11. | Service levels have been maintained for the on-reserve population. | |
# and % of individuals, families and communities receiving required preventive, screening, treatment and support services for community-based health promotion/disease prevention programs by type of service:
|
Maintain service levels (Baseline established in 2008-09). | Maintained service levels in mental wellness, healthy child development and healthy living programs. |
Performance Analysis and Lessons Learned
Health Canada is committed to strengthening primary health care services for First Nations and Inuit communities. Health Canada continued to focus on health promotion and disease prevention programs and to enhance access to services. Evaluations demonstrate that program activities are progressing towards their stated objectives.
The department is taking broad measures to support communities to develop their own health solutions, strengthen health related programming in First Nations and Inuit communities, and improve First Nations and Inuit access to health services through the integration of federal and provincial/territorial programs. These measures include a First Nations Mental Wellness Framework, an Inuit Mental Wellness Framework, the development of primary care community-based addiction treatment protocols, an assessment of workforce training needs and activities that respond to those needs, and steps to improve data quality and timeliness.
Lessons learned from the innovation pilot projects will be considered for the ongoing provision of primary care service delivery in remote and isolated First Nations communities. For example:
- implement partnership strategies with other jurisdictional stakeholders to promote sustainability through long-term community and/or provincial involvement and support;
- improve jurisdictional partnerships in the delivery of health care services through collaborative approaches to primary care service provision (e.g., telerobotics);
- develop strategies to manage the growing community expectations for additional health care services;
- address the ongoing challenges of continuing education and professional development for nurses that impact recruitment and/or retention;
- provide alternative modes to support education (i.e., paper copies and courses on CDs) where high-speed internet is not available in remote communities;
- improve the collaborative team approach (i.e., address issues of resistance to change, duplication of work effort and the working capacity of care teams);
- develop community and team capacity to support the change process; and
- clarify and communicate new team roles and the distribution of client workload among team members.
FSDS Performance Summary
Health Canada undertook a number of actions in key areas to address the stated government priorities as outlined in the Federal Sustainable Development Strategy (FSDS). Access to safe drinking water is a key public health consideration in First Nations and Inuit communities. Health Canada shares responsibility for FSDS Target 3.10: Drinking water quality - Increase the percentage of First Nation communities with acceptable water quality and wastewater facility risk ratings by 2013 with Aboriginal Affairs and Northern Development Canada. In support of this target Health Canada has continued to enhance capacity to monitor drinking water as per the Guidelines for Canadian Drinking Water Quality in First Nations communities by supporting drinking water quality monitoring and access to monitoring personnel (Community-based Water Monitors and Environmental Health Officers. Health Canada also continued to implement the health promotion campaign on mould in support of the National Strategy to Address Mould in First Nations Communities led by Aboriginal Affairs and Northern Development Canada in partnership with Canada Mortgage and Housing Corporation in an effort to increase capacity geared toward the effective prevention and/or remediation of mould in First Nation homes and community facilities.
Health Canada's 2012-13 Departmental Sustainable Development Strategy Performance Report provides additional information.
Sub-Program Reporting 3.1.1 First Nations and Inuit Health Promotion and Disease Prevention
Sub-Program Description
The Health Promotion/Disease Prevention Sub-Program funds and supports a suite of community-based programs, services, initiatives and strategies that collectively aim to reduce the disparities and improve the health outcomes of First Nations and Inuit individuals, families and communities. This is addressed through the provision of culturally relevant health promotion/disease prevention programs and services that focus on three targeted areas: Healthy Child Development; Mental Wellness; and Healthy Living which support the healthy development of children and families, improve mental wellness outcomes and reduce the impact of chronic disease. Activities and priorities are established by recipients and are funded through contribution agreements.
| Planned Spending 2012-13 |
Actual Spending 2012-13 |
Difference 2012-13 |
|---|---|---|
| 475.6 | 509.6 | -34.0 |
Notes: The variance between planned and actual spending and FTE utilization is mainly due to the net effect of funding received for the renewal of the Indian Residential Schools program and savings achieved through simplifying and streamlining operations. These savings did not affect service delivery to First Nations and Inuit.
| Planned 2012-13 |
Actual 2012-13 |
Difference 2012-13 |
|---|---|---|
| 270 | 350 | -80 |
Notes: The variance between planned and actual spending and FTE utilization is mainly due to the net effect of funding received for the renewal of the Indian Residential Schools program and savings achieved through simplifying and streamlining operations. These savings did not affect service delivery to First Nations and Inuit.
| Expected Results | Performance Indicators | Targets | Actual Results |
|---|---|---|---|
| 1. Ongoing access to health promotion/disease prevention programs and services. | # of individuals/families accessing:
|
Target: Maintain Service Levels (Baseline 2008-09). | 441,556 individuals accessed Healthy Child Development, Healthy Living and Mental Wellness programs. |
| 2. Increased community capacity to deliver community-based health promotion and disease prevention programs and services. | # and % of community-based certified/ accredited workers. | Target: Increase by 5% (Baseline 2008-09). | 71% of full-time addiction treatment centre counsellors as of March 2013, up from 70% in 2011-12.
Number of certified addiction workers increased to 545 in 2012-13, up from 493 in 2011-12 exceeding the 5% target. |
Sub-Program 3.1.1 Narrative
A key component of the Health Promotion and Disease Prevention sub-program is addiction prevention and treatment programming delivered through a network of 55 treatment centres, as well as drug and alcohol prevention services in over 550 First Nations and Inuit communities across Canada, as part of the National Native Alcohol and Drug Abuse Program and the National Youth Solvent Abuse Program.
Since 2007, 36 treatment centres have expanded or re-profiled their services to more effectively meet community needs, such as services for women, youth, or people with co-occurring mental health issues or prescription drug abuse issues. The number of accredited treatment centres also continued to increase. In 2012-13, 83% of treatment centres were accredited, up from 76% in 2011-12. The percentage of full-time addiction treatment centre counsellors was 71% as of March 2013, up from 70% in 2011-12. Likewise, the number of certified addiction workers increased to 545 in 2012-13, up from 493 in 2011-12.
Under the community-based approach to Prescription Drug Abuse Prevention, a total of 25 projects were implemented in 21 communities in Ontario, Alberta and Atlantic regions. In Ontario, an additional 37 community-based programs were supported, focused on prevention, training, treatment and aftercare.
The Maternal Child Health program and enhanced funding for Aboriginal Head Start On Reserve, continued to support individuals, families and communities in addressing health objectives related to healthy living, mental wellness and healthy child development. Health Canada supported a number of programs and services aimed at contributing to the health and social development of Aboriginal preschool children and their families.
In support of healthy living, a total of $37.6 M in contribution agreements provided services under the Aboriginal Diabetes Initiative (ADI) to more than 600 First Nations and Inuit communities throughout Canada. In 2012-13, 57 community-based workers completed college-based certified training in diabetes prevention and/or health promotion. To date, a total of 432 workers have been trained under ADI.
Contributing to mental wellness, Health Canada supported First Nations and Inuit communities to reduce risk factors, promote protective factors, and improve health outcomes. The National Aboriginal Youth Suicide Prevention Strategy funded a total of 136 community-based suicide prevention projects for at-risk First Nations and Inuit communities. Projects were diverse, firmly rooted in culture and focused on youth.
Sub-Program Reporting 3.1.2 First Nations and Inuit Public Health Protection
Sub-Program Description
The Public Health Protection sub-activity is a core component of public health and supports a range of programs and initiatives aimed at preventing and/or mitigating human health risks associated with communicable diseases and exposure to hazards within the natural and built environments. Efforts are directed at the population, community and individual levels and include: provision of health services to prevent, manage and control communicable diseases and help assure the safety of food, water and living environments; promotion and education efforts to encourage healthy behaviours; research to identify and reduce environmental health risks; strengthening community capacity to take greater control over public health protection; and collaboration with partners to address the determinants of health, many of which are beyond the direct control of the public health system. Communicable disease control and environmental public health activities are targeted to on-reserve First Nations, with some support to address tuberculosis in Inuit communities. Environmental health research activities are directed to on-reserve First Nations and in some cases (climate change and health adaptation, biomonitoring research) also to Inuit and First Nations living north of 60. Surveillance information underpins public health protection activities. Programming is delivered directly by Health Canada and through contribution agreements with First Nations and Inuit organizations and communities, and with other stakeholders.
| Planned Spending 2012-13 |
Actual Spending 2012-13 |
Difference 2012-13 |
|---|---|---|
| 134.9 | 152.4 | -17.5 |
Notes: The variance between planned and actual spending and FTE utilization is mainly due to the net effect of funding received for the renewal of Water and Waste Water action plan and savings achieved through simplifying and streamlining operations. These savings did not affect service delivery to First Nations and Inuit.
| Planned 2012-13 |
Actual 2012-13 |
Difference 2012-13 |
|---|---|---|
| 328 | 422 | -94 |
Notes: The variance between planned and actual spending and FTE utilization is mainly due to the net effect of funding received for the renewal of Water and Waste Water action plan and savings achieved through simplifying and streamlining operations. These savings did not affect service delivery to First Nations and Inuit.
| Expected Results | Performance Indicators | Targets | Actual Results |
|---|---|---|---|
| 1. Increased community capacity to manage and administer communicable disease control programs. | % of FN communities with integrated Pandemic Preparedness/Response Plans and Emergency Preparedness/Response Plans. | Target: 25% increase (Baseline 2010-11). (Note: The target is for 75% of communities to have an integrated plan by March 2016. The current baseline is 25%.) |
Information will be available March 31, 2016. |
| 2. Increased program and community capacity to address and mitigate environmental public health risks. | % of on-reserve drinking water systems (5 or more connections) sampled in accordance with national guidelines. | Target: Year-over-year increase of 20%. (Note: target being corrected and should have read “20% increase over 4 years”.) |
59.3% of on-reserve drinking water systems (5 or more connections) were sampled in accordance with national guidelines. |
Sub-Program 3.1.2 Narrative
Public Health Protection sub-programs have progressed toward their goals. For example, initial findings from an ongoing evaluation of the Action Plan to Protect Human Health from Environmental Contaminants (report to be available Fall 2013) indicated that a majority of Canadians and First Nations and Inuit are aware of connections between environmental exposures and health. This awareness may motivate individuals to take protective actions against environmental risks, which is a core component of this program.
Similarly, preliminary findings from the Federal Initiative to address HIV/AIDS in Canada (report to be available April 2014) show that increased access to prevention, care, treatment and support has positively impacted First Nations and Inuit populations. For example, the “Know Your Status” project in Saskatchewan, which was developed in partnership with First Nation communities, the province and NGOs, has increased access to care for First Nations living with or at risk of HIV. Both of these programs continued to address needs and make progress toward their respective objectives and outcomes.
At the same time, Health Canada continued implementing a variety of activities and approaches under the Public Health Protection sub-program. For example, in terms of environmental public health activities, the department continued to enhance the capacity to monitor drinking water quality to protect public health in First Nation communities. The health promotion campaign in support of the National Strategy to Address Mould in First Nations Communities continued to be implemented. In terms of communicable disease control activities, Health Canada moved forward with the implementation of Health Canada's Strategy Against Tuberculosis for First Nations On-Reserve through the development of national and regional action plans.
Sub-Program Reporting 3.1.3 First Nations and Inuit Primary Care
Sub-Program Description
The Primary Care sub-activity is a coordinated system of health services required to maintain health and treat illness and is the first point of individual contact by First Nations and the Inuit with the health system at the reserve/community level. Primary care is delivered by a collaborative health care team, predominately nurse led, providing a set of integrated and accessible health care services that include assessment, diagnostic, curative, rehabilitative, supportive and palliative/end-of- life care. It is where health promotion and disease prevention actions are directed towards individuals/families in the course of provision of care. The identification of cases requiring complex care, the coordination/and or integration of care, and timely referral to appropriate provincial/territorial secondary and tertiary levels of care outside the community are also essential elements of primary care. Primary care services are provided directly to First Nations and Inuit communities or through contribution agreements in locations where these services are not provided by provincial/territorial health systems and are necessary to ensure that First Nation /Inuit individuals and communities have access to the full range of health services as other provincial/territorial residents in similar geographic locations. Funds are used to support the staffing and operation of nursing stations on reserve, home and community care programs in First Nation and Inuit communities and on-reserve hospitals in Manitoba.
| Planned Spending 2012-13 |
Actual Spending 2012-13 |
Difference 2012-13 |
|---|---|---|
| 281.2 | 319.0 | -37.8 |
Notes: The variance between planned and actual spending and FTE utilization is mainly due to the net effect of funding received to assure continuity of access to Clinical and Client Care nursing services in remote and isolated First Nations communities and savings achieved through simplifying and streamlining operations. These savings did not affect service delivery to First Nations and Inuit.
| Planned 2012-13 |
Actual 2012-13 |
Difference 2012-13 |
|---|---|---|
| 624 | 821 | -197 |
Notes: The variance between planned and actual spending and FTE utilization is mainly due to the net effect of funding received to assure continuity of access to Clinical and Client Care nursing services in remote and isolated First Nations communities and savings achieved through simplifying and streamlining operations. These savings did not affect service delivery to First Nations and Inuit.
| Expected Results | Performance Indicators | Targets | Actual Results |
|---|---|---|---|
| 1. Increasingly appropriate primary care services based on assessed need. | Primary Care Utilization Rate by type of service:
|
Target: Maintain Utilization rate for CCC will be measured against a baseline of 294.56 per 1,000. Utilization rate for HCC will be measured against a baseline of 71.24 per 1,000. |
CCC utilization rate was 294.56 per 1,000. HCC utilization rate was 66.09 per 1,000. |
| % of clients who are satisfied with Primary Care Services provided. | Target: 75% | Information will be available March 31, 2015. | |
| 2. Improved coordinated and seamless responses to primary care needs. | % of FN communities with collaborative service delivery arrangements with external primary care service providers. | Target: 50% of communities. | 64% communities with collaborative service delivery arrangements. |
Sub-Program 3.1.3 Narrative
An evaluation of the Clinical and Client Care Program (CCC) (report to be available Fall, 2013) showed the program progressing towards its intended outcomes of being responsive to the needs of First Nations individuals and communities through the provision of urgent and non-urgent health care services. Meanwhile, preliminary evaluation findings of the Home and Community Care Program (FNIHCC) show that it continues to address and is responsive to a demonstrable need for home care and community services among First Nations and Inuit. The report is to be available in winter 2014.
Health Canada also continued to respond to the findings and recommendations of recent Primary Health Care Program evaluations including: First Nations & Inuit Health and Addictions Cluster Evaluation (2012); and Evaluation of First Nations National Nursing Innovation Strategy Program (2013).
Program 3.2: Supplementary Health Benefits for First Nations and Inuit
The Non-Insured Health Benefits (NIHB) Program provides a specified range of medically necessary health-related goods and services to registered Indians (according to the Indian Act) and Inuit (recognized by one of the Inuit Land Claim Organizations) in Canada where not otherwise covered under a separate agreement (e.g. a self-government agreement) with federal, provincial or territorial governments. The benefits under the NIHB Program include the following, where not otherwise provided to eligible clients through private or provincial/ territorial programs: pharmacy benefits (prescription drugs and some over-the-counter medication), medical supplies and equipment, dental care, vision care, short term crisis intervention mental health counselling, and medical transportation benefits to access medically required health services not available on reserve or in the community of residence. The Program also pays provincial health premiums on behalf of eligible clients in British Columbia.
| Total Budgetary Expenditures (Main Estimates) 2012-13 |
Planned Spending 2012-13 |
Total Authorities (available for use) 2012-13 |
Actual Spending (authorities used) 2012-13 |
Difference 2012-13 |
|---|---|---|---|---|
| 1,006.9 | 1,006.9 | 1,190.0 | 1,155.6 | -148.7 |
Notes: The increase of $183.1M from planned spending to total authorities is mainly due to the net effect of funding received through Supplementary Estimates to maintain the provision of supplementary health benefits to eligible First Nations and Inuit and savings achieved through simplifying and streamlining operations. These savings did not affect service delivery to First Nations and Inuit. The variance of $34.4M between total authorities and actual spending is mainly due to the lower than projected demand for supplementary health benefits in 2012-13.
| Planned 2012-13 |
Actual 2012-13 |
Difference 2012-13 |
|---|---|---|
| 521 | 506 | 15 |
| Expected Results | Performance Indicators | Targets | Actual Results |
|---|---|---|---|
| 1. Access to non-insured health benefits appropriate to the unique health needs of First Nations people and Inuit. | % of FN/I population who accessed NIHB by type of benefit:
|
Maintain access levels according to medical necessity. | Access Levels maintained. Utilization rates remained stable over the past three years; Pharmacy (62%), Medical Supplies and Equipment (6%), and Dental utilization rate (36%). Medical transportation and vision care utilization rates are expected to be maintained. |
| 2. Efficient management of access to non-insured health benefits. | Administrative cost ratio (ratio of administration costs to benefit expenditures). | Reduce to 6.0% over 5 years. | Achieved a 4.9% Administrative Cost Ratio for Pharmacy and Dental Prior Approvals. |
Performance Analysis and Lessons Learned
The Non-Insured Health Benefits (NIHB) Program continued to fund the provision of supplementary health benefits not already provided through other private or provincial programs to 896,624 eligible First Nations and Inuit. In 2012-13, Health Canada managed agreements with 1,777 medical supplies and equipment providers, 14,769 dental providers, and 9,390 pharmacy providers.
Health Canada continued to take concrete steps to increase efficiency and reduce administrative costs. In 2012-13, Health Canada:
- Focused on enhancing enforcement of the coordination of benefits in cases where clients have alternative health benefits coverage. In 2012-13, the department coordinated 1,658,879 pharmacy claims (an increase of 286,628 from 2011-12) and 239,381 dental care claims (an increase of 34,240 from 2011-12), resulting in $430K in cost avoidance;
- Expanded its short term dispensing policy to restrict the maximum frequency with which the Program will reimburse dispensing fees for a specified list of drugs, achieving savings of $2.3M;
- Streamlined the Pharmacy and Dental Prior Approval requirements to achieve a 4.9% Administrative Cost Ratio;
- Implemented a fraud detection software system to enhance anomaly detection capabilities for the pharmacy benefit.
Through the Prescription Drug Abuse Strategy, the NIHB Program also implemented a wide range of actions to enhance the safety of eligible First Nations and Inuit clients including: monitoring prescription drug use, prescribing and dispensing patterns; placing restrictions on opioids and other drugs of concern; and establishing maximum monthly and daily drug limits. The department also enhanced the Prescription Monitoring Program (PMP) which monitors client utilization of certain drugs of concern in order to identify and address potential misuse, as well as increased the number of clients enrolled in the PMP to over 900 clients from 377 in the previous year. Additional details on NIHB's client safety measures are available in the Client Safety Report section of the NIHB Annual Report.
Health Canada implemented various actions to respond to the 2010 departmental evaluation's recommendations. Among them and consistent with the authority granted by Treasury Board, NIHB developed a business case to evaluate the cost effectiveness of centralizing or outsourcing claims processing under the vision care benefit as part of the current claims processing contract.
The program also worked with provincial and territorial counterparts to identify further opportunities for alignment, integration and streamlining processes.
Program 3.3: Health Infrastructure Support for First Nations and Inuit
The Health Infrastructure Support activity underpins the long-term vision of an integrated health system with greater First Nations and Inuit control by enhancing their capacity to design, manage, deliver and evaluate quality health programs and services. It provides the foundation to support the delivery of programs and services in First Nations and Inuit communities and for individuals and promotes innovation and partnerships in health care delivery to meet the unique health needs of First Nations and Inuit. The funds are used for: planning and management for the delivery of quality health services, construction and maintenance of health facilities, research activities, encouraging Aboriginal people to pursue health careers, investments in technologies to modernize health services, and integrate and realign the governance of existing health services.
| Total Budgetary Expenditures (Main Estimates) 2012-13 |
Planned Spending 2012-13 |
Total Authorities (available for use) 2012-13 |
Actual Spending (authorities used) 2012-13 |
Difference 2012-13 |
|---|---|---|---|---|
| 272.1 | 272.1 | 356.7 | 305.9 | -33.8 |
Notes: The increase of $84.6M between planned spending and total authorities is mainly due to the net effect of a transfer of resources to support maintenance of First Nations health facilities and the initial contribution to support the B.C. Tripartite agreement.
| Planned 2012-13 |
Actual 2012-13 |
Difference 2012-13 |
|---|---|---|
| 236 | 227 | 9 |
| Expected Results | Performance Indicators | Targets | Actual Results |
|---|---|---|---|
1. Promote innovative integrated health governance relationships. |
% of provinces/territories with multi-jurisdictional agreements to jointly plan, deliver and/or fund integrated health services for aboriginal Canadians. | 100% by March 2015. | Health Services Integration Fund: more than 70 projects have been approved in 11 provinces and territories. |
2. Improved First Nations and Inuit capacity to influence and/or control (design, deliver, and manage) health programs and services. |
# of communities involved in the planning process to influence and/or control (design, deliver, and manage) health programs and services. | 5% increase (2-3 communities) in the number of communities involved by 2016. | 5% increase achieved. |
Performance Analysis and Lessons Learned
Health Canada provided ongoing support to First Nations and Inuit communities, provincial and territorial governments in the promotion of better integration of programs and services.
Much of the ongoing work under this Program involved engagement and coordination of health infrastructure initiatives with partners, particularly the Assembly of First Nations, the Inuit Tapiriit Kanatami, the Public Health Agency of Canada and Aboriginal Affairs and Northern Development Canada. Through collaboration, partners developed approaches in areas of mutual interest for advancing First Nations and Inuit health, guided health survey research and analysis, and sought to harmonize or improve the practices and systems that departments use to manage contribution agreements.
The 2011 eHealth Infostructure Program evaluation made five recommendations from which ten actions were identified in the Management Response Action Plan. To date, eight of these actions have been addressed. Actions implemented include: developing a business case at both the national and regional level; updating readiness assessments to reflect community funding priorities; identifying priorities for training/education activities at the regional level; meeting with stakeholders to build e-health capacity in First Nations communities for several projects/initiatives; and, implementing a comprehensive communication approach.
Sub-Program Reporting 3.3.1 First Nations and Inuit Health System Capacity
Sub-Program Description
The Health System Capacity Sub-Activity is the foundation for the overall management and implementation of First Nations and Inuit health programs and services. It enhances First Nations and Inuit capacity to design, manage, deliver and evaluate quality health programs and services through planning, management and infrastructure. This Sub-Activity also supports the promotion of Aboriginal participation in health careers, and the development of and access to health research, information and knowledge to inform all aspects of health programs and services. The funds are used for: planning and management for the delivery of quality health services; construction and maintenance of health facilities; health practitioner core competency training; health education bursaries and scholarships; research activities; and stakeholder engagement.
| Planned Spending 2012-13 |
Actual Spending 2012-13 |
Difference 2012-13 |
|---|---|---|
| 224.8 | 246.5 | -21.6 |
Notes: The variance between planned and actual spending is mainly due to the net effect of increased spending on maintenance of First Nations health facilities and savings achieved through simplifying and streamlining operations. These savings did not affect service delivery to First Nations and Inuit.
| Planned 2012-13 |
Actual 2012-13 |
Difference 2012-13 |
|---|---|---|
| 88 | 81 | 7 |
| Expected Results | Performance Indicators | Targets | Actual Results |
|---|---|---|---|
1. Improved quality in the delivery of programs and services. |
# of communities accessing health care from accredited organizations. | Target: 5% increase per year (accreditation). | 24% increase.
78 communities accessed accredited health services (March 31, 2013) compared with 63 communities who accessed accredited health services (March 31, 2012). |
2. Safe health facilities that support health program delivery. |
% of on-reserve health facilities that meet health and safety codes/construction standards. | Target: 3% increase per year.
(Note: 2011-12 Baseline was 55%.) |
Data not available. To improve performance measurement, the performance indicators will be adjusted to align with data currently collected. |
Sub-Program 3.3.1 Narrative
The health facility Long-Term Capital Plan (LTCP) links program operating requirements, including current and future needs and risks, with specific capital project proposals. The LTCP is used to identify, assess, and prioritize capital projects for implementation. Through the LTCP in 2012-13, 14 multi-year major projects and 90 minor projects were identified and approved for funding.
To facilitate on-going health system improvement, partnerships to support community capacity development, including the training of community-based workers, were developed with partner organizations. An MOU between Health Canada and Aboriginal Affairs and Northern Development Canada was signed in March 2013. This partnership supports indigenous community development through various means, including joint training.
Sub-Program Reporting 3.3.2 First Nations and Inuit Health System Transformation
Sub-Program Description
The Health System Transformation Sub-Activity supports a range of programs focusing on the integration, coordination and innovation of the health systems which serve First Nations. Activities include the development of innovative approaches to primary health care, investment in technologies that enhance health service delivery and the realignment of health governance structures to permit greater First Nations participation and control. Transformation will be achieved by engaging a diverse group of partners, stakeholders and clients including First Nations and Inuit communities, tribal councils, Aboriginal organizations, provincial and regional health departments and authorities, post-secondary educational institutions and associations, health professionals and program administrators.
| Planned Spending 2012-13 |
Actual Spending 2012-13 |
Difference 2012-13 |
|---|---|---|
| 47.4 | 59.5 | -12.1 |
Notes: The variance between planned and actual spending is mainly due to the net effect of funding for the BC tripartite agreement and savings achieved through simplifying and streamlining operations. These savings did not affect service delivery to First Nations and Inuit.
| Planned 2012-13 |
Actual 2012-13 |
Difference 2012-13 |
|---|---|---|
| 147 | 146 | 1 |
| Expected Results | Performance Indicator | Targets | 2012-13 Performance |
|---|---|---|---|
| 1. Key stakeholders in Aboriginal health are engaged in the integration of health services. | % of Provincial/Territorial Advisory Committees in which all key stakeholders in the integration of health services (FN/I/P/T) are represented. | Target: 100% | 100% |
| 2. Access to health information. | # of telehealth sites implemented. | Target: 275 | 275 telehealth sites at the community level. |
Sub-Program 3.3.2 Narrative
Approximately 95% of First Nations communities had high-speed or broadband connectivity. Connectivity is required to make available telehealth services in First Nation communities. There were 275 telehealth/videoconferencing sites implemented at the community level, which improved the efficiency of health care delivery to First Nations and Inuit individuals, families, and communities.
Announced in 2010, the Health Services Integration Fund initiative support collaborative planning and multi-year projects aimed at better meeting the health-care needs of First Nations and Inuit. As of March 2013, more than 70 projects have been approved in 11 provinces and territories. Funded projects vary in focus, with all partners working together to integrate health services in a range of areas such as chronic disease, integrated governance and tripartite planning, maternal/child/youth health, mental health and addictions, primary and continuing care, public health and system logistics.
 Internal Services
Health Canada has a range of internal services. Some, such as financial, administrative, real property, security, human resources, information management and Information Technology, provide the basic infrastructure that enables the Department to function while ensuring compliance to new and existing central agency policies.
Other internal services in Health Canada address departmental and Health Portfolio needs such as general communications and policy activities, as well as managing relations with Parliamentarians, the Cabinet system and other government departments and levels of government. An additional set of internal service roles centre on critical departmental and government-wide responsibilities, such as ensuring the best value for Canadians through planning, accountability and tracking performance and results.
| Total Budgetary Expenditures (Main Estimates) 2012-13 |
Planned Spending 2012-13 |
Total Authorities (available for use) 2012-13 |
Actual Spending (authorities used) 2012-13 |
Difference 2012-13 |
|---|---|---|---|---|
| 278.2 | 293.4 | 426.5 | 374.9 | -81.5 |
Notes: The increase of $133.1M between planned spending and total authorities is mainly due to the receipt of in-year funding in Supplementary Estimates from the department's operating and capital budget carry forwards that was allocated to fund strategic investments in IM/IT and Real Property. The total authorities were also supplemented by payments required by collective agreements. The variance of $51.6M between total authorities and actual spending was primarily due to the changes in the timing of selected investment plan projects.
| Planned 2012-13 |
Actual 2012-13 |
Difference 2012-13 |
|---|---|---|
| 2,507 | 2,462 | 45 |
Notes: The variance between planned and actual FTE utilization is mainly due to the net effect of the transfer of various internal services functions and related FTEs to the Public Health Agency of Canada as part of the Portfolio Shared Services Partnership (in support of Economic Action Plan 2012) and savings resulting from simplifying and streamlining operations. Most reductions in FTEs were achieved through attrition and voluntary departures.
Performance Analysis and Lessons Learned
Health Canada and the Public Health Agency of Canada have consolidated several internal service functions. The shared service model allows both organizations to generate economies, harmonize policies and practices and enhance collaboration. A strong joint governance model supported by a written partnership agreement allowed both organizations, to see its benefit in its first year.
IS 1 Governance and Management Support
Health Canada continued to focus on improving the delivery of internal services while building department-wide approaches to service delivery and providing expert advice on the various aspects of the department's Investment Plan. The department advanced the integration of operational planning and budget management planning by working closely with branch planners and functional areas to standardize processes.
Health Canada and PHAC worked to ensure that all Canadians are engaged and have access to the information they need to take action on their health and safety. Under the new Shared Services Model, Health Canada and PHAC streamlined services and aligned communications activities and services to support and enhance ministerial, departmental/agency and program priorities.
Social marketing campaigns provided Canadians with information to assist in making healthier and safer choices. For example, the Canadian Health and Safety Campaign increased awareness about a new website that contains recalls and safety alerts for food, consumer products, vehicles and health products in one location. Other marketing campaigns on topics such as food safety, immunization and environmental health were successfully delivered, many using social media tools (YouTube, Facebook, and Twitter) to engage Canadians on key health and safety issues. Partnerships with the private sector were also established to extend the reach and impact of messaging. Health Canada continued to increase its transparency and engagement with Canadians and stakeholders through innovative communications tools and approaches, contributing to the Government of Canada's Open Government Initiative. The department developed guidelines to make better use of social media to engage the public and strengthen the consistency of its consultation processes by using new tools and applying best practices.
IS 2 Resource Management Services
The department continued to embed strategic human resource planning into its management practices. It developed a 3-year Strategic HR Plan that identifies key human resources management issues, priorities, and resolution strategies taking into account the current operating environment.
Major organizational and business changes occurred due to the transition of resources to Shared Services Canada, the provision of services to the Public Health Agency Canada, and the centralization of IT. Engagement with Shared Services is ongoing with respect to establishing operating protocols.
Strategic financial and operational support to client branches focused on transformative initiatives aimed at achieving higher efficiency, effectiveness, and value for money. A highlight of this work was the implementation of the Procure to Pay Initiative. Standardized business processes, extensive automation and improved internal controls resulted in increased efficiency and accuracy and a reduction in operational costs.
A shared service for Access to Information and Privacy (ATIP) was established to allow for a streamlined and consistent approach to applying the Access to Information Act and the Privacy Act and managing ATIP requests in both institutions.
A “Reuse, Partner, Buy, Build” direction was adopted to ensure efficient use of human and financial resources in the provision of IT solutions. The department focused on leading-edge application development, including developing a mobile application competency centre.
IS 3 Asset Management Services
Transition to a shared services model involved a review and update of Health Canada's real property and security governance frameworks and policies. A Departmental Security Plan was developed and approved in July 2012. Health Canada developed a new Business Impact Assessment tool to enhance its business continuity planning. Outstanding achievements in Business Continuity Management were recognized with a 2012 Disaster Recovery Institute Canada Award for Excellence.
FSDS Performance Summary
Health Canada, through the Internal Services Program Activity, contributes to Theme IV of the Federal Sustainable Development Strategy - Shrinking the Environmental Footprint of Government. Implementation strategies for Greening Government Operations (GGO) have been developed for green buildings, green procurement, e-waste, managed print, paper consumption and greenhouse gas emissions from fleet. In 2012-13 progress has been made in the following areas:
- Under Health Canada's Green Buildings Strategic Framework:
- completed BOMA BESt assessments of all custodial facilities and achieved level 1 certification at one location and level 2 certification at an additional location; and
- achieved a rating of 3 Green Globes at three office accommodation projects in line with targets;
- Documented the existing process for managing surplus electronic and electrical equipment in an environmentally safe and secure manner;
- Achieved a departmental employee to printer ratio of 7.5:1. While this narrowly missed the Government of Canada target of 8:1, the Department continues to work towards achieving and surpassing the target;
- Achieved a 40% reduction in office paper consumption from the 2010-11 baseline which surpasses the target of a 10% reduction;
- Decreased the Department's on-road fleet-related greenhouse gas emissions by 16% from the 2005-06 baseline year, and in so doing so, Health Canada continues to surpass its commitment of an overall 10% reduction target by 2020-21;
- Increased to 53% the percentage of specified purchases of office supplies identified as having environmental features. This puts Health Canada on track to achieving the self-selected target of 60% in 2013-14;
- Increased the percentage of environmentally friendly information technology hardware purchases to 92% from baseline of 29% in 2009-10; and,
- Increased to 64% the percentage of vehicles purchased that were right-sized for operational needs; deemed to be the most fuel efficient vehicle in their class (as per Health Canada Fleet Standard), and/or are an alternative fuel vehicle up from 48%, as reported in 2011-12.
For additional details on Health Canada's GGO activities, please consult the GGO Supplementary Information Tables.
Section III: Supplementary Information
Financial Highlights
Condensed Statement of Operations and Departmental Net Financial Position
| 2012-13 Planned Results (Restated) |
2012-13 Actual | 2011-12 Actual (Restated) |
$ Change (2012-13 Planned vs. Actual) | $ Change (2012-13 Actual vs. 2011-12 Actual) | |
|---|---|---|---|---|---|
| Total expenses | $ 3,506,529 | $ 3,782,097 | $ 3,918,345 | $ (275,568) | $ (136,248) |
| Total revenues | 113,139 | 100,347 | 98,156 | 12,792 | 2,191 |
| Net cost from continuing operations | 3,393,390 | 3,681,750 | 3,820,189 | (288,360) | (138,439) |
| Transferred Operations | - | - | 35,273 | - | (35,273) |
| Net cost of operations before government funding and transfers | $ 3,393,390 | $ 3,681,750 | $ 3,855,462 | $ (288,360) | $ (173,712) |
| Departmental net financial position | $ (524,612) | $ (413,245) | $ (622,608) | $ (111,367) | $ 209,363 |
The Department's total expenses were $3.8B in 2012-13.
There is an increase of $275.6M when comparing planned results to actual expenditures for 2012-13. This is primarily a result of funding received through Supplementary Estimates B relative to demand driven programs related to First Nations and Inuit Non-insured Health Benefits, which are subject to annual government assessments and budget considerations.
There is a decrease of approximately $136.2M when comparing year-over-year actual expenditures. The significant changes were:
- Decrease of $103.0M in salaries and employee benefits resulting primarily from workforce adjustment costs expensed in the prior year and a decrease in costs associated with the accumulation and liquidation of severance pay due to changes in some collective agreements;
- Decrease of $31.4M in other expenses due to a provision for contingent liabilities recorded in the prior year;
- Decrease of $18.2M in transfer payments as a result of recoveries from prior years; and
- Decrease of $12.1M in repairs and maintenance resulting mostly from a reduction in the overall cost of maintaining laboratories.
These decreases are offset by:
- Increase of $18.4M in professional and special services for the purchase of back office services from the Public Health Agency of Canada; and
- Increase of $11.3M travel for non-insured health patients, a demand driven program which experiences fluctuations in usage and cost due to demand.
The Department's total revenues were $100.3M in 2012-13 representing a modest increase of $2.2M over the prior year actual revenues.
Condensed Statement of Financial Position
| 2012-13 | 2011-12 (Restated) | $ Change | |
|---|---|---|---|
| Total net liabilities | $ 874,643 | $ 1,076,875 | $ (202,232) |
| Total net financial assets | 319,694 | 304,879 | 14,815 |
| Departmental net debt | 554,949 | 771,996 | (217,047) |
| Total non-financial assets | 141,704 | 149,388 | (7,684) |
| Departmental net financial position | $ (413,245) | $ (622,608) | $ 209,363 |
Total net liabilities were $874.6M at the end of 2012-13, a decrease of $202.2M from the previous year comprised mainly of:
- Decrease of $123.2M as a result of payments to Canada Health Infoway Inc. drawing down the liability originating from the 2007 and 2009 Budgets;
- Decrease of $50.5M in employee future benefits due to the liquidation of severance pay and termination benefits and cessation of accumulation of benefit obligations as a result of changes in some collective agreements; and
- Decrease of $38.8M in accounts payable and accrued liabilities due to a reduction in the accrual for workforce adjustment costs and offset by an increase in accrued salaries and wages and timing differences in settling accounts payable.
The year-over-year increase in total net financial assets of $14.8M is primarily a result of the increase in amounts due from the Consolidated Revenue Fund, reflecting changes in accounts payable and accrued liabilities.
Financial Statements
The financial statements including the Annex to the Statement of Management Responsibility including Internal Control over Financial Reporting can be found on Health Canada's web site.
Supplementary Information Tables
All electronic supplementary information tables can be found within the 2012-13 Departmental Performance Report on the Health Canada website.
- Details on Transfer Payment Programs (TPPs)
- Greening Government Operations
- Horizontal Initiatives
- Internal Audits and Evaluations
- Response to Parliamentary Committees and External Audits
- Sources of Respendable and Non-Respendable Revenue
- Status Report on Major Crown/Transformational Projects
- Status Reports on Projects Operating With Specific Treasury Board Approval
- Up-Front Multi-Year Funding
- User Fees Reporting
Tax Expenditures and Evaluations Report
The tax system can be used to achieve public policy objectives through the application of special measures such as low tax rates, exemptions, deductions, deferrals and credits. The Department of Finance publishes cost estimates and projections for these measures annually in the Tax Expenditures and Evaluations publication. The tax measures presented in the Tax Expenditures and Evaluations publication are the sole responsibility of the Minister of Finance.Section IV: Other Items of Interest
Organizational Contact Information
Marc Desjardins
Director General
Planning and Corporate Management Practices Directorate
Jeanne Mance Building - Floor: 11 - Room: 1109
200 Eglantine Driveway, Tunney's Pasture
Ottawa, Ontario K1A 0K9
Telephone: 613-948-6357
Elimination of Hazardous Materials Information Review Commission
In keeping with the provisions of the Jobs and Growth Act, 2012, which amended the Hazardous Materials Information Review Act (HMIRA), the responsibilities and functions of the Hazardous Materials Information Review Commission (HMIRC) were transferred to Health Canada and HMIRC has been dissolved as a standalone agency as of April 1, 2013. These changes were administrative in nature and Health Canada will continue to ensure the protection of confidential business information (CBI). Health Canada will also continue to demonstrate federal leadership in the protection of the health and safety of workers. In addition, the appeal function under the HMIRA will remain.
The amendments to the HMIRA also establish a Ministerial Advisory Council that reflects the same composition as the HMIRC Council of Governors. The Ministerial Advisory Council will report directly to the Minister of Health.
HMIRC 2012-13 Financial Highlights
| 2012-13 Planned Results |
2012-13 Actual |
2011-12 Actual |
$ Change (2012-13 Planned vs.Actual) |
$ Change (2012-13 Actual vs. 2011-12 Actual) |
|
|---|---|---|---|---|---|
| Total expenses | $ 5,280,233 | $ 4,234,118 | $ 6,341,785 | $ 1,046,115 | $ (2,107,667) |
| Total revenues | - | - | - | - | - |
| Net cost of operations before government funding and transfers | $ 5,280,233 | $ 4,234,118 | $ 6,341,785 | $ 1,046,115 | $ (2,107,667) |
| Commission net financial position | $ (439,569) | $(1,978,006) | $ 1,538,437 |
The Commission's total expenses were $4.2M in 2012-13.
There is a decrease of $1.0M when comparing planned results to actual expenditures for 2012-13. Planned results were formulated prior to the announcement of Canada Economic Action Plan 2012. Much of the decrease can be attributed to the decrease in salaries and employee benefits as a result of Canada Economic Action Plan 2012.
There is a decrease of $2.1M when comparing year-over-year actual expenditures comprised mainly of:
- Decrease of $2.5M in salaries and employee benefits resulting primarily from workforce adjustment costs expensed in the prior year and a decrease in costs associated with the accumulation and liquidation of severance pay due to changes in some collective agreements, as well as reduced staff; and
- Increase of $0.4M in professional and special services.
| 2012-13 | 2011-12 | $ Change | |
|---|---|---|---|
| Total net liabilities | $ 705,967 | $ 2,049,106 | $ (1,343,139) |
| Total net financial assets | 266,398 | 71,100 | 195,298 |
| Commission net debt | 439,569 | 1,978,006 | (1,538,437) |
| Commission net financial position | $ (439,569) | $ (1,978,006) | $ 1,538,437 |
Total net liabilities were $0.7M at the end of 2012-13, a decrease of $1.3M from the previous year comprised mainly of:
- Decrease of $1.0M in accounts payable and accrued liabilities due to a reduction in the accrual for workforce adjustment costs;
- Decrease of $0.2M in vacation pay and compensatory leave as a result of reduction in staff; and
- Decrease of $0.1M in employee future benefits due to the liquidation of severance pay and termination benefits and cessation of accumulation of benefit obligations as a result of changes in some collective agreements.
The year-over-year increase in total net financial assets of $0.2M is primarily a result of the increase in amount due from the Consolidated Revenue Fund which reflects changes in various cash flow components.
HAZARDOUS MATERIALS INFORMATION REVIEW COMMISSION
Statement of Management Responsibility Including Internal Control Over Financial Reporting
Responsibility for the integrity and objectivity of the accompanying financial statements for the year ended March 31, 2013, and all information contained in these statements rests with the management of Hazardous Materials Information Review Commission (the Commission). These financial statements have been prepared by management using the Government's accounting policies, which are based on Canadian public sector accounting standards.
Management is responsible for the integrity and objectivity of the information in these financial statements. Some of the information in the financial statements is based on management's best estimates and judgment, and gives due consideration to materiality. To fulfill its accounting and reporting responsibilities, management maintains a set of accounts that provides a centralized record of the Commission's financial transactions. Financial information submitted in the preparation of the Public Accounts of Canada, and included in the Commission's Departmental Performance Report, is consistent with these financial statements.
Management is also responsible for maintaining an effective system of internal control over financial reporting (ICFR) designed to provide reasonable assurance that financial information is reliable, that assets are safeguarded and that transactions are properly authorized and recorded in accordance with the Financial Administration Act and other applicable legislation, regulations, authorities and policies.
Management seeks to ensure the objectivity and integrity of data in its financial statements through careful selection, training and development of qualified staff; through organizational arrangements that provide appropriate divisions of responsibility; through communication programs aimed at ensuring that regulations, policies, standards, and managerial authorities are understood throughout the Commission and through conducting an annual risk-based assessment of the effectiveness of the system of ICFR.
The system of ICFR is designed to mitigate risks to a reasonable level based on an ongoing process to identify key risks, to assess effectiveness of associated key control, and to make any necessary adjustments.
The financial statements of Hazardous Materials Information Review Commission have not been audited.
George Da Pont
Deputy Minister
Health Canada
Ottawa, Canada
Date: August 23, 2013
Jamie Tibbetts
Assistant Deputy Minister and Chief Financial Officer
Health Canada
Ottawa, Canada
Date: August 18, 2013
| 2013 | 2012 | |
|---|---|---|
| Liabilities | ||
| Accounts payable and accrued liabilities (note 5) | $ 266,232 | $ 1,305,641 |
| Vacation pay and compensatory leave | 8,519 | 190,950 |
| Employee future benefits (note 6) | 431,216 | 552,515 |
| Total net liabilities | 705,967 | 2,049,106 |
| Financial assets | ||
| Due from Consolidated Revenue Fund | 228,698 | 51,795 |
| Accounts receivable and advances (note 7) | 37,700 | 19,305 |
| Total net financial assets | 266,398 | 71,100 |
| Commission net debt | 439,569 | 1,978,006 |
| Commission net financial position | (439,569) | (1,978,006) |
Dissolution of Hazardous Materials Information Review Commission (note 2)
The accompanying notes form an integral part of these financial statements.
George Da Pont
Deputy Minister
Health Canada
Ottawa, Canada
Date: August 23, 2013
Jamie Tibbetts
Assistant Deputy Minister and Chief Financial Officer
Health Canada
Ottawa, Canada
Date: August 18, 2013
| 2013 Planned Results |
2013 | 2012 | |
|---|---|---|---|
| Expenses | |||
| Statutory decisions and compliant information | $ 3,245,564 | $ 2,529,591 | $ 2,634,883 |
| Stakeholder engagement and strategic partnerships | 626,193 | 400,679 | 819,885 |
| Internal services | 1,408,476 | 1,303,848 | 2,887,017 |
| Total expenses | 5,280,233 | 4,234,118 | 6,341,785 |
| Revenues | |||
| Client services | 569,621 | 500,073 | 639,379 |
| Revenues earned on behalf of Government | (569,621) | (500,073) | (639,379) |
| Total revenues | - | - | - |
| Net cost of operations before government funding and transfers | $ 5,280,233 | 4,234,118 | 6,341,785 |
| Government funding and transfers | |||
| Net cash provided by Government | 4,737,456 | 4,506,694 | |
| Change in due from Consolidated Revenue Fund | 176,903 | 22,808 | |
| Services provided without charge by other government departments (note 8) | 858,196 | 863,280 | |
| Net cost of operations after government funding and transfers | (1,538,437) | 949,003 | |
| Commission net financial position - Beginning of year | (1,978,006) | (1,029,003) | |
| Commission net financial position - End of year | $ (439,569) | $ (1,978,006) | |
Segmented information (note 9)
The accompanying notes form an integral part of these financial statements.
| 2013 | 2012 | |
|---|---|---|
| Net cost of operations after government funding and transfers | $ (1,538,437) | $ 949,003 |
| Net increase (decrease) in Commission net debt | (1,538,437) | 949,003 |
| Commission net debt - Beginning of year | 1,978,006 | 1,029,003 |
| Commission net debt - End of year | $ 439,569 | $ 1,978,006 |
The accompanying notes form an integral part of these financial statements.
| 2013 | 2012 | |
|---|---|---|
| Operating activities | ||
| Net cost of operations before government funding and transfers | $ 4,234,118 | $ 6,341,785 |
| Non-cash items: Services provided without charge by other government departments (note 8) |
(858,196) | (863,280) |
| Variations in Statement of Financial Position: | ||
| Decrease (increase) in accounts payable and accrued liabilities | 1,039,409 | (1,160,097) |
| Decrease in vacation pay and compensatory leave | 182,431 | 65,268 |
| Decrease in employee future benefits | 121,299 | 211,663 |
| Increase (decrease) in accounts receivable and advances | 18,395 | (88,645) |
| Cash used in operating activities | 4,737,456 | 4,506,694 |
| Net cash provided by Government of Canada | 4,737,456 | 4,506,694 |
The accompanying notes form an integral part of these financial statements.
Hazardous Materials Information Review Commission
Notes to the Financial Statements (Unaudited)
For the Year Ended March 31, 2013
1. Authority and objectives
The Hazardous Materials Information Review Commission (HMIRC) was created as an independent quasi-judicial agency in 1987 by proclamation of the Hazardous Materials Information Review Act and is accountable to the Parliament of Canada through the Minister of Health. The Commission is charged with providing the trade secret protection mechanism within the Workplace Hazardous Materials Information System (WHMIS). Priorities and reporting are aligned under the following strategic outcome and related program activities:
Strategic Outcome: Chemical trade secrets are protected and health and safety information in Canadian workplaces is compliant.
Statutory decisions and compliant information
The Workplace Hazardous Materials Information System (WHMIS) requires chemical manufacturers, importers, distributors, and employers to provide cautionary labelling and material safety data sheets (MSDSs) for every controlled product produced, used or intended for use by workers in Canadian workplaces. Pursuant to the Hazardous Materials Information Review Act, the Hazardous Materials Information Review Commission has the mandate to make decisions on the validity of claims for exemption from disclosure requirements under WHMIS, while ensuring that associated health and safety information made available to Canadian workers is compliant with the WHMIS standards. Specifically, to fulfill its program requirements, the Commission registers claims, issues decisions on claim validity and compliance, offers claimants an opportunity to comply voluntarily and when necessary, orders claimants to take actions to bring MSDSs and/or labels into compliance. In carrying out this program, the Commission fosters proactive compliance. It assists claimants in respecting relevant statutory requirements by providing the information, knowledge, tools and support they need to submit complete and accurate claims and bring associated MSDSs and/or labels into compliance.
Stakeholder engagement and strategic partnerships
The exclusive work completed by the Commission enables it to gather unique information and data holdings on hazard communications under the Workplace Hazardous Materials Information System in terms of completeness, accuracy, comprehensibility and accessibility. Through partnerships, the Commission attempts to more fully a) mine, b) test and compare and c) share its knowledge so as to improve hazard communications for Canadian industry and Canadian workers. It also uses this knowledge to improve the understanding and proficiency of interested domestic and international public bodies in developing hazard communication approaches, tools and standards. Consequently, this program supports the establishment of mutually beneficial partnerships that contribute to the creation and distribution of information and knowledge that enhance the safe handling of hazardous chemicals.
Internal services
Internal services are groups of related activities and resources that are administered to support the needs of programs and other corporate obligations of an organization. At HMIRC these groups are: Management and Oversight Services; Legal Services; Communications Services; Human Resources Management Services; Financial Management Services; Information Management Services; Information Technology Services; Acquisition Services; and Travel and Other Administrative Services. Internal Services include only those activities and resources that apply across an organization and not to those provided specifically to a program.
2. Dissolution of Hazardous Materials Information Review Commission
On March 27, 2013, His Excellency the Governor in Council, on the recommendation of the Prime Minister, the Minister of Health and the Treasury Board issued Order in Councils which fixed the date of dissolution of the Commission.
- Order in Council PC 2013-0339 which, pursuant to subsection 285(1) of the Jobs and Growth Act, 2012, declares that the persons set out in the annexed schedule, who are persons appointed under section 38 of the Hazardous Materials Information Review Act , occupy their positions in the Department of Health effective March 31, 2013.
- Order in Council PC 2013-0340 which, pursuant to subsection 298 of the Jobs and Growth Act , 2012, Chapter 31 of the Statutes of Canada, 2012, fixes April 1, 2013 as the day on which Division 13, other than section 285, of Part 4 of that Act comes into force.
These financial statements represent the results of operations for the period ended March 31, 2013 and the financial position of the Commission at March 31, 2013, immediately before the transfer of assets and liabilities to Health Canada on April 1, 2013.
3. Summary of significant accounting policies
These financial statements have been prepared using the Government's accounting policies stated below, which are based on Canadian public sector accounting standards. The presentation and results using the stated accounting policies do not result in any significant differences from Canadian public sector accounting standards.
Significant accounting policies are as follows:
(a) Parliamentary authorities
The Hazardous Materials Information Review Commission is financed by the Government of Canada through Parliamentary authorities. Financial reporting of authorities provided to the Commission do not parallel financial reporting according to generally accepted accounting principles since authorities are primarily based on cash flow requirements. Consequently, items recognized in the Statement of Financial Position and in the Statement of Operations and Commission Net Financial Position are not necessarily the same as those provided through authorities from Parliament. Note 3 provides a reconciliation between the bases of reporting. The planned results amounts in the Statement of Operations and Commission Net Financial Position are the amounts reported in the future-oriented financial statements included in the 2012-13 Report on Plans and Priorities.
(b) Net cash provided by Government
The Commission operates within the Consolidated Revenue Fund (CRF), which is administered by the Receiver General for Canada. All cash received by the Commission is deposited to the CRF and all cash disbursements made by the Commission are paid from the CRF. The net cash provided by Government is the difference between all cash receipts and all cash disbursements including transactions between departments of the Government.
(c) Amounts due from the Consolidated Revenue Fund
Amounts due from the CRF are the result of timing differences at year-end between when a transaction affects authorities and when it is processed through the CRF. Amounts due from the CRF represent the net amount of cash that the Commission is entitled to draw from the CRF without further authorities to discharge its liabilities.
(d) Revenues
- Revenues from regulatory fees are recognized in the accounts based on the services provided in the year;
- Other revenues are accounted for in the period in which the underlying transaction or event that gave rise to the revenue takes place;
- Revenues that are non-respendable are not available to discharge the Commission's liabilities. While the Deputy Head is expected to maintain accounting control, he or she has no authority regarding the disposition of non-respendable revenues. As a result, non-respendable revenues are considered to be earned on the behalf of the Government of Canada and are therefore presented in reduction of the entity's gross revenues.
(e) Expenses
Expenses are recorded on the accrual basis:
- Vacation pay and compensatory leave are accrued as the benefits are earned by employees under their respective terms of employment;
- Services provided without charge by other government departments for accommodation and employer contribution to health and dental insurance plans are recorded as operating expenses at their estimated cost.
(f) Employee future benefits
i) Pension benefits: Eligible employees participate in the Public Service Pension Plan, a multi-employer pension plan administered by the Government. The Commission's contributions to the Plan are charged to expenses in the year incurred and represent the total departmental obligation to the Plan. The Commission's responsibility with regard to the Plan is limited to its contributions. Actuarial surpluses or deficiencies are recognized in the financial statements of the Government of Canada, as the Plan's sponsor.
ii) Severance benefits: Employees entitled to severance benefits under labour contracts or conditions of employment earn these benefits as services necessary to earn them are rendered. The obligation relating to the benefits earned by employees is calculated using information derived from the results of the actuarially determined liability for employee severance benefits for the Government as a whole.
(g) Accounts receivable
Accounts receivable are stated at the lower of cost and net recoverable value. They are mainly comprised of amounts to be recovered from other government departments and the recovery is considered certain. As a result, no provision has been recorded as an offset against these amounts.
(h) Measurement uncertainty
The preparation of these financial statements requires management to make estimates and assumptions that affect the reported amounts of assets, liabilities, revenues and expenses reported in the financial statements. At the time of preparation of these statements, management believes the estimates and assumptions to be reasonable. The most significant item where estimates are used is the liability for employee future benefits. Actual results could significantly differ from those estimated. Management's estimates are reviewed periodically and, as adjustments become necessary, they are recorded in the financial statements in the year that they become known.
4. Parliamentary authorities
Hazardous Materials Information Review Commission receives most of its funding through annual parliamentary authorities. Items recognized in the Statement of Financial Position and the Statement of Operations and Commission Net Financial Position in one year may be funded through parliamentary authorities in prior, current or future years. Accordingly, the Commission has different net results of operations for the year on a government funding basis than on an accrual accounting basis.The differences are reconciled in the following tables:
| 2013 | 2012 | |
|---|---|---|
| Net cost of operations before government funding and transfers | $ 4,234,118 | $ 6,341,785 |
| Adjustments for items affecting net cost of operations but not affecting authorities | ||
| Services provided without charge by other government departments | (858,196) | (863,280) |
| Decrease in vacation pay and compensatory leave | 182,431 | 65,268 |
| Decrease in employee future benefits | 101,065 | 211,663 |
| Refund/adjustment of previous year's expenditures | 645 | 1,467 |
| Bad debt expense | (213) | (413) |
| Workforce adjustment measures | 1,225,521 | (1,225,521) |
| Total items affecting net cost of operations but not affecting authorities | 651,253 | (1,810,816) |
| Current year authorities used | $ 4,885,371 | $ 4,530,969 |
| 2013 | 2012 | |
|---|---|---|
| Authorities provided: | ||
| Vote 30 - Program expenditures | $ -- | $ 4,211,451 |
| Vote 40 - Program expenditures | 4,462,748 | - |
| Statutory amounts | 559,061 | 593,184 |
| 5,021,809 | 4,804,635 | |
| Less: | ||
| Lapsed authorities | (136,438) | (273,666) |
| Current year authorities used | $ 4,885,371 | $ 4,530,969 |
5. Accounts payable and accrued liabilities
The following table presents details of the Commission's accounts payable and accrued liabilities:
| (in dollars) | 2013 | 2012 |
|---|---|---|
| Accounts payable - external parties | $ - | $ 10,288 |
| Accounts payable - other government departments and agencies | 1,457 | 5,180 |
| Total accounts payable | 1,457 | 15,468 |
| Accrued liabilities | 264,775 | 1,290,173 |
| Total accounts payable and accrued liabilities | $ 266,232 | $ 1,305,641 |
6. Employee future benefits
(a) Pension benefits
The Commission's employees participate in the Public Service Pension Plan, which is sponsored and administered by the Government. Pension benefits accrue up to a maximum period of 35 years at a rate of 2% per year of pensionable service, times the average of the best five consecutive years of earnings. The benefits are integrated with Canada/Québec Pension Plans benefits and they are indexed to inflation.
Both the employees and the Commission contribute to the cost of the Plan. The 2012-13 expense represents approximately 1.7 times (1.8 times in 2011-12) the contributions by employees which amount to:
| (in dollars) | 2013 | 2012 |
|---|---|---|
| Expense for the year | $ 399,170 | $ 426,499 |
The Commission's responsibility with regard to the Plan is limited to its contributions. Actuarial surpluses or deficiencies are recognized in the financial statements of the Government of Canada, as the Plan's sponsor.
(b) Severance benefits
The Commission provides severance benefits to its employees based on eligibility, years of service and salary at termination of employment. These severance benefits are not pre-funded. Benefits will be paid from future authorities.
As part of collective agreement negotiations with certain employee groups, and changes to conditions of employment for executives and certain non-represented employees, the accumulation of severance benefits under the employee severance pay program ceased for these employees commencing in 2012. Employees subject to these changes have been given the option to be immediately paid the full or partial value of benefits earned to date or collect the full or remaining value of benefits on termination from the public service. These changes have been reflected in the calculation of the outstanding severance benefit obligation.
Information about the severance benefits, measured as at March 31, is as follows:
| (in dollars) | 2013 | 2012 |
|---|---|---|
| Accrued benefit obligation - Beginning of year | $ 552,515 | $ 764,178 |
| Expense for the year | 71,508 | (15,370) |
| Benefits paid during the year | (192,807) | (196,293) |
| Accrued benefit obligation - End of year | $ 431,216 | $ 552,515 |
7. Accounts receivable and advances
The following table presents details of the Hazardous Materials Information Review Commission's accounts receivable and advances balances:
| (in dollars) | 2013 | 2012 |
|---|---|---|
| Accounts receivable - external parties | $ - | $ 9,940 |
| Accounts receivables - other government departments and agencies | 37,700 | 19,005 |
| Employee advances | - | 300 |
| Subtotal | 37,700 | 29,245 |
| Allowance for doubtful accounts on receivables from external parties | - | (9,940) |
| Net accounts receivable and advances | $ 37,700 | $ 19,305 |
8. Related party transactions
The Commission is related as a result of common ownership to all government departments, agencies, and Crown corporations. The Commission enters into transactions with these entities in the normal course of business and on normal trade terms. Also, during the year, the Commission received services which were obtained without charge from other government departments as disclosed below.
(a) Common Services provided without charge by other government departments:
During the year, the Commission received services without charge from certain common service organizations, related to accommodation and the employer's contribution to the health and dental insurance plans. These services provided without charge have been recorded in the Commission's Statement of Operations and Commission Net Financial Position as follows:
| (in dollars) | 2013 | 2012 |
|---|---|---|
| Accommodation | $ 569,355 | $ 563,851 |
| Employer's contribution to the health and dental insurance plans | 288,841 | 299,429 |
| Total | $ 858,196 | $ 863,280 |
The Government has centralized some of its administrative activities for efficiency, cost-effectiveness purposes and economic delivery of programs to the public. As a result, the Government uses central agencies and common service organizations so that one department performs services for all other departments and agencies without charge. The costs of these services, such as the payroll and cheque issuance services provided by Public Works and Government Services Canada, are not included in the Commission's Statement of Operations and Commission Net Financial Position.
(b) Other transactions with related parties:
| (in dollars) | 2013 | 2012 |
|---|---|---|
| Expenses - other government departments and agencies | $ 102,191 | $ 68,894 |
9. Segmented information
Expenses and revenues disclosed in (b) exclude common services provided without charges, which are already disclosed in (a).
| Statutory decisions and compliant information | Stakeholder engagement and strategic partnerships | Internal services | 2013 Total |
2012 Total | |
|---|---|---|---|---|---|
| Expenses | |||||
| Salaries and employee benefits | $ 1,982,907 | $ 282,456 | $ 654,078 | $ 2,919,441 | $ 5,429,158 |
| Accommodation | 338,902 | 67,780 | 162,673 | 569,355 | 563,851 |
| Professional and special services | 149,219 | 1,659 | 400,187 | 551,065 | 168,750 |
| Utilities, materials and supplies | 33,339 | 48,316 | 11,968 | 93,623 | 64,760 |
| Communications | 4,206 | - | 29,724 | 33,930 | 40,959 |
| Travel and relocation | 14,954 | 468 | 8,766 | 24,188 | 20,326 |
| Information services | - | - | 22,971 | 22,971 | 31,840 |
| Rentals | 6,064 | - | 9,726 | 15,790 | 18,899 |
| Purchased repair and maintenance | - | - | 3,542 | 3,542 | 2,812 |
| Bad debts | - | - | 213 | 213 | 413 |
| Other | - | - | - | - | 17 |
| Total expenses | 2,529,591 | 400,679 | 1,303,848 | 4,234,118 | 6,341,785 |
| Revenues | |||||
| Client services | 499,860 | - | 213 | 500,073 | 639,379 |
| Revenues earned on behalf of Government | (499,860) | - | (213) | (500,073) | (639,379) |
| Total Revenues | - | - | - | - | - |
| Net cost of operations before government funding and transfers | $ 2,529,591 | $ 400,679 | $ 1,303,848 | $ 4,234,118 | $ 6,341,785 |