Job Market Trends and News
Canada

Following labour market events is key to helping job seekers understand where the opportunities (short, medium and long-term) might be in a local community and elsewhere in the country.
The following table offers significant events from past four weeks that may affect the supply and demand in the labour force across Canada. It can prove to be a useful resource to complement your job search and career exploration.
You can explore news items across Canada on this page or refine your search to a specific news event type, sector or region.
Canada by the numbers
-
Unemployment Rate: (Jul 2017)6.3%

-
Employment: (Jul 2017)18,421,900

-
Average Weekly Earning: (May 2017)$972.41
Job Vacancy and Wage Survey, first quarter 2017
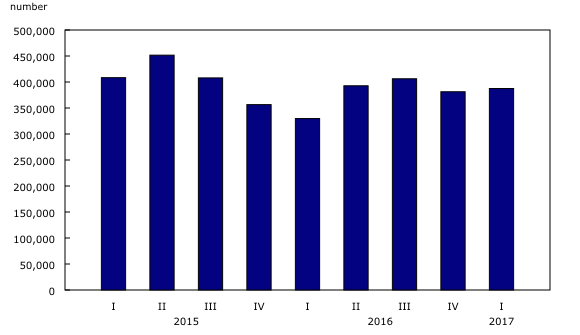
Job vacancies rose by 58,000 (+17.5%) from the first quarter of 2016 to 388,000 in the first quarter of 2017. Over that same period, the job vacancy rate increased 0.4 percentage points to 2.5%. This was the second consecutive year-over-year increase in the number of vacancies and the job vacancy rate. All comparisons are on a year-over-year basis, unless otherwise specified.
The job vacancy rate refers to the share of jobs that are unfilled out of all available payroll jobs. It represents the number of job vacancies expressed as a percentage of labour demand; that is, the sum of all occupied and vacant jobs.
Compared with the fourth quarter of 2016, the number of job vacancies (unadjusted for seasonality) in the first quarter of 2017 was little changed in Canada, while the job vacancy rate rose 0.1 percentage points. By comparison, both the number of job vacancies (-7.5%) and the job vacancy rate (-0.2 percentage points) fell from the fourth quarter of 2015 to the first quarter of 2016.
Job vacancies rise in six provinces, including a first-time increase in Alberta
The number of job vacancies rose in six provinces, led by Ontario and Quebec. Job vacancies decreased in Saskatchewan as well as in Newfoundland and Labrador, and were little changed in Nova Scotia and Manitoba. In the territories, job vacancies fell in the Northwest Territories and Yukon, and were little changed in Nunavut.
Job vacancies in Ontario were up 33,000 (+23.9%) to 171,000, a third consecutive year-over-year increase in the province. The job vacancy rate in Ontario rose 0.5 percentage points to 2.8%, with notable vacancy increases in the economic regions of Toronto and HamiltonżNiagara Peninsula. Compared with the previous year, job vacancies for both full-time (+27,000) and part-time (+5,600) work rose in Ontario.
In Quebec, the number of job vacancies rose by 15,000 (+28.1%) to 68,000, with increases observed throughout the province. Most of the growth was for full-time work and permanent positions. Compared with one year ago, the job vacancy rate in Quebec rose 0.4 percentage points to 2.0%. The number of employees grew 1.9% over the same period, compared with a national rate of 1.5%. According to the Labour Force Survey (LFS), the unemployment rate decreased from 7.5% in 2016 to 6.3%.
Job vacancies in British Columbia rose by 7,000 (+11.4%) to 68,000 in the first quarter and the job vacancy rate increased 0.2 percentage points to 3.2%. British Columbia has had the highest job vacancy rate among the provinces since the third quarter of 2015. Growth in job vacancies was concentrated in Lower MainlandżSouthwest, which accounted for about 81% of the rise in vacancies in the province. More than 90% of the increase in job vacancies was for full-time positions.
Job vacancies in Alberta rose by 3,600 (+9.3%) to 43,000, and the job vacancy rate was up 0.2 percentage points to 2.2%. This was the first year-over-year increase for Alberta in the number of job vacancies and the job vacancy rate since the first quarter of 2015, when data were first collected. Increases in vacancies for full-time positions accounted for 59% of the year-over-year rise in total job vacancies. Recent data from the LFS point to improved labour market conditions in Alberta. Following notable declines from the fall of 2015 to the summer of 2016, employment has increased while the unemployment rate has trended downward since November 2016.

New Brunswick employers reported 5,700 job vacancies in the first quarter, 900 (+19.7%) more than the previous year. The additional job vacancies were concentrated in full-time and permanent positions. Over this period, the job vacancy rate in the province was up 0.3 percentage points to 2.0%.
In contrast, year-over-year declines in the number of job vacancies in Saskatchewan continued in the first quarter, with vacancies decreasing by 1,000 (-10.5%) to 8,500. Notable declines were recorded in retail trade as well as in accommodation and food services. However, job vacancies rose in several sectors, including mining, quarrying, and oil and gas extraction, and manufacturing. In the first quarter, the vacancy rate was down to 1.8% from 2.0% one year earlier.
In Newfoundland and Labrador, job vacancies were down by 400 (-10.3%) to 3,100 in the first quarter. The decrease in vacancies was concentrated in Avalon Peninsula. Compared with one year earlier, the job vacancy rate in Newfoundland and Labrador was down 0.2 percentage points to 1.5%, the lowest rate in the country.
Increase in the number of vacancies and the job vacancy rate in the 10 largest industrial sectors
On a year-over-year basis, the number of job vacancies and the job vacancy rate in the first quarter were up in the 10 largest industrial sectors. Within these large sectors, the biggest increases in the job vacancy rate were in administrative and support services (up 0.9 percentage points to 4.2%); transportation and warehousing (up 0.6 percentage points to 2.7%); and construction (up 0.5 percentage points to 2.8%).
Most of the smaller sectors (in terms of employment) also registered increases in the number of vacancies and their job vacancy rates. For example, the job vacancy rate in agriculture, forestry, fishing and hunting rose to 5.3% in the first quarter, up from 3.9% the previous year. The rate in mining, quarrying, and oil and gas extraction also increased, rising 1.1 percentage points to 1.9%. This was the second consecutive year-over-year increase in the job vacancy rate for this sector. Alberta accounted for 56% of the net increase in vacancies in mining, quarrying, and oil and gas extraction.

Within mining, quarrying, and oil and gas extraction, the rise in job vacancies was mainly the result of increases in support activities for mining, and oil and gas extraction (+1,400) as well as mining and quarrying (except oil and gas) (+700). The number of job vacancies and the job vacancy rate were also up in oil and gas extraction, but to a lesser extent.
These increases were likely interrelated, with an increase in overall job vacancies (+1,000) observed in three detailed occupation groups related to mining, quarrying, and oil and gas extraction: mine service workers and operators in oil and gas drilling; underground miners, oil and gas drillers; and contractors and supervisors in mining, oil and gas.
Widespread increases in job vacancies across broad occupational categories
The number of job vacancies was up in 9 of the 10 broad occupational categories in the first quarter. The exception was management occupations, where vacancies were little changed compared with the same quarter in 2016. The largest increases in job vacancies were in trades, transport and equipment operators and related occupations (+15,000); and business, finance and administration occupations (+8,600).
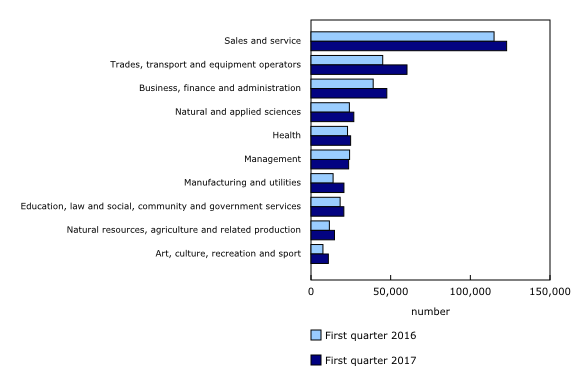
Ontario (+6,500), Quebec (+3,600) and Alberta (+3,300) had the largest increases in trades, transport and equipment operators and related occupations. These three provinces also contributed the most to the rise in job vacancies in business, finance and administration occupations.
Within trades, transport and equipment operators and related occupations, notable year-over-year increases were observed for motor vehicle and transit drivers (+3,400) and longshore workers and material handlers (+1,700). General office workers (+1,300) and human resources and business service professionals (+1,300) had among the largest increases within business, finance and administration occupations.
The average offered hourly wage increases in six provinces
Nationally, the average offered hourly wage was up $0.55 or 2.8% to $20.40 in the first quarter, compared with $19.85 during the same month one year earlier.
Changes in the average offered hourly wage can reflect a variety of factors, including wage growth and changes in the composition of job vacancies by occupation, by sector and between part- and full-time positions.
The average offered hourly wage rose in six provinces, with New Brunswick registering the largest year-over-year growth. The offered wage fell in three provinces, including Quebec, where a 44% increase in the number of job vacancies in retail trade (a sector with relatively low wages) contributed to the decrease in the provincial offered wage.
To view more news items, please select a Province or Territory from the top menu.
Canadian Occupational Projection System
COPS projections allow for identifying those occupations that are likely to face shortage or surplus of workers over the medium term.
Users can search for occupational summaries, more detailed data and technical documents on the results or the methodology used to do the projections.
National Projections (2015-2024)
 Unemployment Rate
-
7.8%
-
5.3%
-
5.0%
-
8.1%
-
15.7%
-
7.9%
-
6.1%
-
10.0%
-
5.8%
-
6.6%
 Employment
-
2,284,200
-
2,481,200
-
649,100
-
352,200
-
219,000
-
450,200
-
7,106,300
-
73,500
-
4,238,000
-
568,000
 Average Weekly Earnings
-
$1,120.19
-
$939.99
-
$915.20
-
$880.67
-
$1,034.05
-
$848.60
-
$987.11
-
$820.56
-
$895.34
-
$1,004.59