Quarterly Financial Report for the quarter ended September 30, 2016 (Revised)
Download the printer-friendly version (PDF)
About this publication
Publication author : Canada Economic Development for Quebec regions
Publish date : November 29, 2016
Summary :
Financial report of the Agency on its spending trends for the second quarter.
Table of Contents
- Section 1: Introduction
- Section 2: Highlights of fiscal quarter and year-to-date results
- Section 3: Risks and uncertainties
- Section 4: Significant changes in relation to operations, personnel and programs
- Statement of Authorities (unaudited)
- Departmental Budgetary Expenditures by Standard Object (unaudited)
Section 1: Introduction
Erratum
Date: December 19, 2016
Location: Appendices 5.2 Departmental Budgetary Expenditures by Standard Object (unaudited) - For the quarter ended September 30, 2016.
Revision: “Transfer payments - Expended during the quarter ended September 30, 2016; $41 904 thousands” replaces “Transfer payments - Expended during the quarter ended September 30, 2016; $41 903 thousands” AND “Other subsidies and payments - Expended during the quarter ended September 30, 2016; $335 thousands” replaces “replace “Other subsidies and payments - Expended during the quarter ended September 30, 2016; $322 thousands”.
Rationale for the revision: Original amount reported was not correct.
This quarterly financial report has been prepared by Canada Economic Development (CED), as required by subsection 65.1 of the Financial Administration Act and in the form and manner prescribed by Treasury Board Accounting Standard 1.3 – Departmental and Agency Quarterly Financial Report.
This quarterly report should be read in conjunction with the 2016–2017 Main Estimates, the Supplementary Estimates, and with the quarterly reports preceding the current fiscal year.
This report has not been subject to external audit or review.
1.1 Authorities, mandate and program activities
Under the Economic Development Agency of Canada for the Regions of Quebec Act, which came into effect on October 5, 2005, CED’s mission is to promote the long-term economic development of the regions of Quebec by paying special attention to those regions with slow economic growth or inadequate opportunities for productive employment.
Additional information on the CED’s authority, mandate and program activities can be found in the Main Estimates and the Report on Plans and Priorities.
1.2 Basis of presentation
This quarterly report has been prepared by CED, using an expenditure basis of accounting and a special purpose financial framework designed to meet financial information needs with respect to spending authorities. The accompanying Statement of Authorities includes the spending authorities granted by Parliament and used by CED, consistent with the Main Estimates and Supplementary Estimates for the 2016–2017 fiscal year.
The pre-authorization of Parliament is required before funds can be spent by the Government. Authorities available for use are given in the form of annually approved limits through appropriation acts or through legislation in the form of statutory authorities for specific purposes.
As part of the parliamentary business of supply, the Main Estimates must be tabled in Parliament on or before March first preceding the new fiscal year.
When Parliament is dissolved for the purposes of a general election, section 30 of the Financial Administration Act authorizes the Governor General, under certain conditions, to issue a special warrant authorizing the Government to withdraw funds from the Consolidated Revenue Fund. A special warrant is deemed to be an appropriation for the fiscal year in which it is issued.
1.3 Canada Economic Development (CED) financial structure
CED manages its expenditures under two annual votes:
- Vote 1 – Net Operating Expenditures—includes CED authorities related to personnel costs, and operating and maintenance expenditures.
- Vote 5 – Grants and Contributions—includes all authorities related to transfer payments.
Costs under statutory authorities, which represent payments made under legislation approved previously by Parliament and which are not part of the annual appropriation bills, include such items as the employer’s share of the employee benefits plan.
Section 2: Highlights of fiscal quarter and year-to-date results
This section provides a variety of financial information for the current fiscal year up to September 30, 2016, including authorities available for the year and expenditures made during the second quarter, as compared with the previous fiscal year.
The explanations of variances are based on the premise that discrepancies of less than 5% have a minimal impact on the interpretation of the results.
Further details of this financial information are provided in sections 2.1 and 2.2, and in the appended tables.
2.1 Analysis of authorities
At the end of the second quarter, CED's annual authorities totalled $320.6M. They were $318.7M as at June 30, 2016. The difference of $1.9M is essentially due to the operating-budget carry-forward from 2015–2016 (Vote 1 Authorities).
When we compare the current authorities for fiscal year 2016–2017 ($320.6M) to the authorities for 2015–2016 during the same period ($263.4M), we see a $57.6M increase in funding for this year. This increase can be broken down as follows:
- Vote 1 Net Operating Expenditures of $(0.1)M;
- Vote 5 Grants and Contributions of $57.6M; and
- Budgetary Statutory Authorities of $0.1M.
The following graph illustrates the annual budgetary authorities by appropriation as at June 30, 2016, and as at September 30, 2016, compared with the previous fiscal year (in 2015–2016, the authorities as at June 30 and September 30 were the same).
Annual budgetary authorities by appropriation as at June 30, and as at September 30, fiscal year 2016-2017, compared with 2015-2016

Graphic 1 - Long description
Analysis of annual budgetary authorities by appropriation: Subdivided into three sections, this graph provides an overview of net available budget authorities by appropriation (Vote 1 – Net Operating Expenditures, Vote 5 – Grants and Contributions, and Budgetary Statutory Authorities) as at June 30, 2016, and September 30, 2016, including a comparison with June 30, 2015 and September 30 2015.
As at September 30, 2016, Vote 1 authorities (Net Operating Expenditures) totaled $40.0M, compared with $40.2M in 2015–2016; Vote 5 authorities (Grants and Contributions) $276.6M compared with $218.0 in 2015–2016; and Budgetary Statutory Authorities $4.9 M, compared with $4.8 M in 2015–2016.
As at June 30, 2016, Vote 1 authorities (Net Operating Expenditures) totaled $38.2M, compared with $38.3M in 2015–2016; Vote 5 authorities (Grants and Contributions) $275.6M, compared with $218.0M in 2015–2016; and Budgetary Statutory Authorities $4.9M, compared with $4.8M in 2015–2016.
Vote 1 authorities (net operating expenditures)
The increase of $1.9M as at September 30, 2016, compared with June 30, 2016, is essentially due to the approval of the operating-budget carry-forward from 2015–2016. Compared with the same period during fiscal year 2015–2016, this is a decrease of $0.2M (0.02%). This variance is not significant.
Vote 5 authorities (grants and contributions)
Authorities did not fluctuate between the first and second quarters of 2016–2017.
As at September 30, 2015, the available annual Vote 5 authorities totalled $218.0M. As at September 30, 2016, this amount is $275.6M, an increase of $57.6M (26.4%). Essentially, this increase can be explained by the following:
- Funding allocated to the Canada 150 Community Infrastructure Program (CIP 150) (+$15.5M);
- Funding allocated to the Canada 150 Community Infrastructure Program Component 2 (CIP 150 Component 2) (+$15.6M);
- Funding allocated to the extension of the natural gas distribution system between Lévis and Sainte-Claire (Bellechasse gas pipeline) (+$14.5M);
- Increased amount resulting from the reinvestment of our clients' repayable contributions (+$7.4M);
- An increase in the amount for the Canadian Economic Diversification Initiative for Communities Dependent on the Chrysotile Industry (+$4.5M); and
- Other adjustments (+$0.1M).
2.2 Analysis of expenditures
CED expenditures recorded during the second quarter of 2016–2017 totalled $52.2M, compared with $50.0M for the same period last year. This represents a net increase of $2.2M (4.4%) compared with the previous fiscal year. This increase can be explained by the following:
- Decrease of $0.1M in Vote 1 expenditures (net operating expenditures);
- Increase of $2.7M in Vote 5 expenditures (grants and contributions); and
- Decrease of $0.4M in statutory expenditures.
The total year-to-date expenditures as at September 30, 2016, were $80.8M, compared with $83.5M for the same period last year (3.3% decrease). This variance is not significant.
The following graph illustrates the second-quarter and year-to-date expenditures per vote, compared with the previous fiscal year.
Second-quarter and year-to-date expenditures as at September 30, bt appropriation, fiscal year 2016-2017, compared with 2015-2016
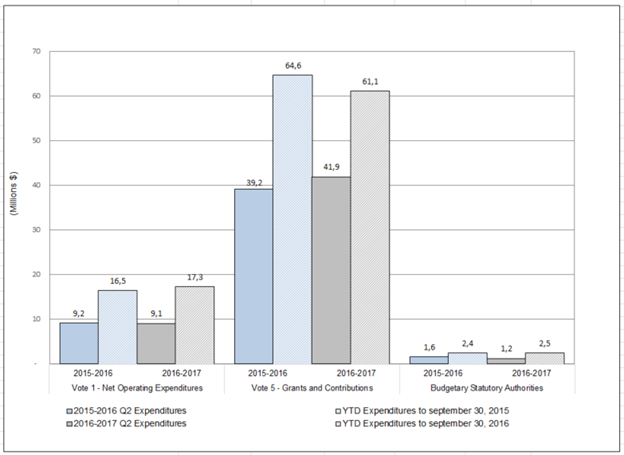
Graphic 2 - Long description
Analysis of second quarter and year to date expenditures as at September 30 by appropriation, for fiscal year 2016–2017, compared with 2015–2016: Subdivided into three sections (Vote 1 – Net Operating Expenditures, Vote 5 – Grants and Contributions, and Budgetary Statutory Authorities), this graph illustrates the expenditures made during the second quarter of 2016–2017 and year to date expenditures as at September 30, 2016, including a comparison with fiscal year 2015–2016.
For the second quarter, Vote 1 authorities (Net Operating Expenditures) totaled $9.1M, compared with $9.2M in 2015–2016; year to date Vote 5 authorities (Grants and Contributions) $41.9M, compared with $39.2M in 2015–2016; and year to date Budgetary Statutory Authorities $1.2M, compared with $1.6M in 2015–2016.
As at September 30, 2016, year to date Vote 1 authorities (Net Operating Expenditures) totaled $17.3M, compared with $16.5M in 2015–2016; year to date Vote 5 authorities (Grants and Contributions) $61.1M, compared with $64.6M in 2015–2016; and year to date Budgetary Statutory Authorities $2.5M, compared with $2.4M in 2015–2016.
Vote 1 expenditures (net operating expenditures)
The net operating expenditures for the second quarter of 2016–2017 totalled $9.1M, compared with $9.2M for the same period in 2015–2016. This represents an increase of $0.1M (1%). The variance is therefore not significant.
The year-to-date expenditures recorded in 2016–2017 totalled $17.3M, compared with $16.5M in 2015–2016, for a 4.8% increase this year. The variance is therefore not significant.
(For further details on these expenditures, see Appendix 5.2, Departmental Budgetary Expenditures by Standard Object).
Vote 5 expenditures (grants and contributions)
With regard to Vote 5, when we compare the expenditures made this quarter ($41.9M) with those made during the second quarter of 2015–2016 ($39.2M), we see an increase of $2.7M (6.9%). This increase is attributable to the rate at which clients submitted their claims.
Although the grants and contributions budgets increased significantly since last year (26.4%), the expenditures for both fiscal years remained relatively similar in the first two quarters. This is mainly due to the low level of expenditures on new CIP projects during this period.
The disbursement rate for QEDP is higher than last year. However, the year-to-date expenditures for 2016–2017 ($61.1M) were down slightly from those of the previous fiscal year ($64.6M) by $3.5M (5.5%). This variance can be explained by the fact that claims processing returned to normal after an exceptional start to 2015–2016. The difference stems from a slightly weaker disbursement rate for projects approved in the initiatives. The situation will normalize over the coming quarters.
(For further details on these expenditures, see Appendix 5.2, Departmental Budgetary Expenditures by Standard Object).
Section 3: Risks and uncertainties
To achieve its outcomes, CED needs to have an overview of the changing factors that strongly influence its environment and activities, and it incorporates these factors into its decision-making processes. Incorporating risk management into departmental planning allows CED to implement appropriate risk management strategies to achieve its outcomes. The financial risks are mitigated in large part by the implementation of strong internal controls over financial reporting. CED conducts periodic assessments, such as entity level controls, general computer controls and business process controls.
Since CED has a mandate to promote economic development, its main risk—economic risk and institutional capacity—is directly related to changes in the economic growth outlook for Quebec and Canada. Its mandate is also influenced by the supply of funding from other levels of government and the private sector, as well as by the potential postponement of investment decisions by SMEs. To mitigate this risk, for example, CED continually monitors changes in provincial, national and international economic environments as well as provincial and national programs.
CED manages its resources through a well-defined framework of responsibilities, policies and procedures, including an appropriate budget and reporting system and other controls, which allow it to manage its activities within available resources and parliamentary authorities. It regularly monitors their progress and effectiveness by conducting a number of budget review processes and activities and by analyzing expenditures and budget forecasts by organizational unit, on a monthly basis.
In April 2016, a new government-wide pay system, called Phoenix, was implemented at CED. This new system led to changes in the pay approval process and the interconnectivity of existing CED systems. Stricter controls were put in place to monitor the system's implementation and its impact on employee pay.
Section 4: Significant changes in relation to operations, personnel and programs
No significant changes in relation to operations and programs have impacted this quarter’s results.
Approval by Senior Officials
Approved by:
________________________
Manon Brassard
Deputy Minister / President
Montreal, Canada
On ________________________
________________________
Maxime Garon
Acting Chief Financial Officer
Statement of Authorities (unaudited)
| Fiscal year 2016-2017 ($ thousands) |
Fiscal year 2015–2016 ($ thousands) |
|||||
|---|---|---|---|---|---|---|
| Authorities | Total available for the year ending March 31, 2017* | Used during the quarter ended September 30, 2016 | Year-to-date used at quarter-end | Total available for the year ending March 16, 2016* | Used during the quarter ended September 30, 2015 | Year-to-date used at quarter-end |
| Vote 1 - Net operating expenditures | 40,047 | 9,074 | 17,293 | 40,162 | 9,210 | 16,475 |
| Vote 5 - Grants and contributions | 275,622 | 41,904 | 61,090 | 217,996 | 39,213 | 64,629 |
| Total budgetary statutory authorities | 4,917 | 1,229 | 2,459 | 4,819 | 1,606 | 2,410 |
| Non-budgetary authorities | - | - | - | - | - | - |
| Total Authorities | 320,586 | 52,207 | 80,842 | 262,978 | 50,029 | 83,514 |
* Includes only Authorities available for use and granted by Parliament at quarter-end.
(An incremental difference in the sum of the amounts may result from rounding.)
Departmental Budgetary Expenditures by Standard Object (unaudited)
| Fiscal year 2016–2017 ($ thousands) |
Fiscal year 2015–2016 ($ thousands) |
|||||
|---|---|---|---|---|---|---|
| Expenditures | Planned expenditures for the year ending March 31, 2017* | Expended during the quarter ended September 30, 2016 | Year-to-date used at quarter-end | Planned expenditures for the year ending March 31, 2016* | Expended during the quarter ended September 30, 2015 | Year-to-date used at quarter-end |
| Staff | 33,507 | 8,382 | 16,223 | 33,506 | 9,038 | 16,099 |
| Transportation and communications | 1,476 | 219 | 420 | 1,607 | 248 | 395 |
| Information | 576 | 77 | 131 | 689 | 45 | 64 |
| Professional and special services | 7,111 | 937 | 1,787 | 6,656 | 1,033 | 1,768 |
| Rentals | 882 | 260 | 287 | 918 | 277 | 302 |
| Repair and maintenance | 56 | 4 | 7 | 115 | 7 | 9 |
| Utilities, materials and supplies | 277 | 29 | 53 | 344 | 35 | 60 |
| Acquisition of land, buildings and works | 0 | 0 | 0 | 0 | 0 | 0 |
| Acquisition of machinery and equipment | 1,056 | 60 | 79 | 1,033 | 144 | 166 |
| Transfer Payments** | 275,622 | 41,904 | 61,090 | 217,996 | 39,213 | 64,629 |
| Other subsidies and payments*** | 23 | 335 | 765 | 115 | (11) | 22 |
| Total net budgetary expenditures | 320,586 | 52,207 | 80,842 | 262,978 | 50,029 | 83,514 |
* Includes only Authorities available for use and granted by Parliament at quarter-end.
(An incremental difference in the sum of the amounts may result from rounding.)
** Erratum - In the section “Transfer payments”, the amount was changed from $41 903 to $41 904.
***Erratum - In the section “Other subsidies and payments”, the amount was changed from $322 to $335.
- Date modified: