Quarterly Financial Report for the quarter ended June 30, 2019
Download the printer-friendly version (PDF)
About this publication
Publication author : Publication author : Canada Economic Development for Quebec Regions
Publish date : August 29, 2019
Summary :
Financial report of the Agency on its spending trends for the 1st quarter of 2019.
Table of Contents
1. Introduction
This quarterly financial report has been prepared by Canada Economic Development for Quebec Regions (CED) as required under section 65.1 of the Financial Administration Act and in the form and manner prescribed by Treasury Board.
This report should be read in conjunction with the 2019–2020 Main Estimates and the 2019–2020 Departmental Plan.
This report has not been subject to an external audit or review.
1.1 Authority, mandate and programs
The mission of Canada Economic Development for Quebec Regions (CED) is to promote the long term economic development of the regions of Quebec by giving special attention to those where economic growth is slow and opportunities for productive employment are inadequate. CED carries out its mandate in accordance with the provisions of the Economic Development Agency of Canada for the Regions of Quebec Act, which came into force on October 5, 2005. Furthermore, CED is committed to promoting cooperation and a complementary relationship with Quebec and its communities.
CED is a key federal player in Quebec for the promotion of economic development in the regions and among small and medium-sized enterprises (SMEs). To achieve its core responsibility, which consists of developing the Quebec economy, CED fosters business start-ups and performance. It helps businesses become more innovative, productive and competitive. It supports community engagement efforts in the various regions of Quebec and the attraction of investment aimed at increasing the prosperity of the Quebec and Canadian economies.
CED contributes to the economic vitality of all of Quebec’s regions by leveraging their competitive regional advantages. It supports the transition and diversification of communities that remain dependent on a limited number of sectors or that have been affected by an economic shock such as the closure of the chrysotile mines or the Lac Mégantic tragedy.
CED has three programs to support its core responsibility:
- Regional Innovation
- Community Vitality
- Targeted or Temporary Support
Additional information on the Agency’s authority, mandate and programs can be found in the 2019–2020 Main Estimates and the 2019–2020 Departmental Plan.
1.2 Basis of presentation
This quarterly report has been prepared by CED using an expenditure basis of accounting. The accompanying Statement of Authorities includes the Agency’s spending authorities granted by Parliament and used by CED in a manner consistent with the Main Estimates for the 2019-2020 fiscal year. This quarterly financial report has been prepared using a special-purpose financial reporting framework designed to meet financial information needs with respect to the use of spending authorities.
Prior authority from Parliament is required before funds can be spent by the Government. Authorities available for use are given in the form of annually approved limits through appropriation acts or through legislation in the form of statutory authority for specific purposes.
When Parliament is dissolved for the purposes of a general election, section 30 of the Financial Administration Act authorizes the Governor General, under certain conditions, to issue a special warrant authorizing the Government to withdraw funds from the Consolidated Revenue Fund. A special warrant is deemed to be an appropriation for the fiscal year in which it is issued.
CED uses the full accrual method of accounting to prepare and present its annual financial statements, which make up part of the departmental results reporting process. However, the spending authorities voted by Parliament remain on an expenditure basis of accounting.
1.3 Financial structure of Canada Economic Development for Quebec Regions (CED)
CED manages its expenditures under two annual votes:
- Vote 1 – Net Operating Expenditures, which includes CED authorities related to staff costs and operating and maintenance expenditures.
- Vote 5 – Grants and Contributions, which includes all authorities related to transfer payments.
Costs under statutory authorities, which represent payments made under legislation previously approved by Parliament and which are not part of the annual appropriation bills, include items such as the employer’s share of the Employee Benefits Plan.
2. Highlights of fiscal quarter and fiscal year to date (ytd) results
This section presents a variety of financial information as at June 30, 2019, including the authorities available for the year and expenditures incurred during the first quarter, as compared with the previous fiscal year.
The explanation of variances in the amounts are based on the premise that discrepancies of less than 5% have a minimal impact on the interpretation of the results.
The details of this financial information can be found in sections 2.1 and 2.2, and in the tables in the Appendix.
2.1 Authorities analysis
At the end of the first quarter, i.e. as at June 30, 2019, CED’s annual authorities totalled $319.2M. On June 30, 2018 they stood at $276.5M.
The difference of $42.7M (15.4%) observed can be explained by the following variances:
- Vote 1 – Net Operating Expenditures: $+0.8M
- Vote 5 – Grants and Contributions: $+41.5M
- Budgetary Statutory Authorities: $+0.4M
The following graph illustrates the annual budgetary appropriation authorities as at June 30, 2019, compared with the previous fiscal year.
Annual budgetary appropriation authorities as at June 30, fiscal year 2019-2020, compared with 2018-2019
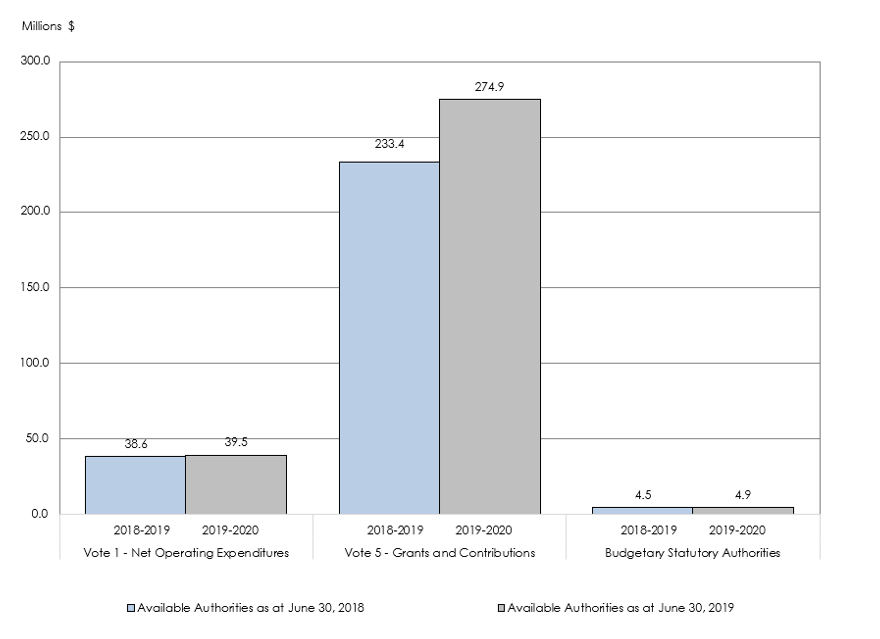
Graph 1 - Long description
Analysis of annual budgetary appropriation authorities: subdivided into three sections, this graph provides an overview of net available budgetary authorities (Vote 1 – Net Operating Expenditures; Vote 5 – Grants and Contributions; and Budgetary Statutory Authorities) as at June 30, 2019, including a comparison as at June 30, 2018.
As at June 30, 2019, annual authorities under Vote 1 – Net Operating Expenditures, Vote 5– Grants and Contributions, and Budgetary Statutory Authorities, totalled $39.4M ($38.6M in 2018–2019), $274.9M ($233.4M in 2018–2019) and $4.9M ($4.5M in 2018 2019), respectively.
Vote 1 authorities (Net Operating Expenditures)
We note an increase of $0.8M (2.1%) as at June 30, 2019, compared with the same period in fiscal year 2018-2019. This variance is primarily attributable to the reception of funds for temporary initiatives under the Innovation and Skills Plan and for the Women’s Entrepreneurship Strategy.
Vote 5 authorities (Grants and Contributions)
As at June 30, 2018, available annual Vote 5 authorities amounted to $233.4M. As at June 30, 2019, authorities stood at $274.9M, an increase of $41.5M (17.8%). This variance is due to numerous factors, among the most important being the granting of funds for temporary initiatives, such as the Innovation and Skills Plan, the Women’s Entrepreneurship Strategy, the Canadian Experiences Fund (tourism) initiative and the Steel and Aluminum Initiative. Also, in 2019-2020, the amounts reinvested in annual authorities from repayable client contributions were higher than in 2018-2019.
2.2 Analysis of expenditures
CED’s total expenditures recorded during the first quarter of 2019-2020 totalled $26M, compared with $34.7M for the same period last year. This represents a net decrease of $8.7M (25.1%) year-over-year.
This variance can be broken down as follows:
- Vote 1 – Net Operating Expenditures: +$0.2M;
- Vote 5 – Grants and Contributions: $-8.9M;
- Budgetary Statutory Authorities: $+0.1M.
The following graph illustrates expenditures in the first quarter of 2019-2020 by budgetary appropriation, in comparison with the previous fiscal year.
First-quarter expenditures by budgetary appropriation, fiscal year 2019-2020, compared with 2018-2019
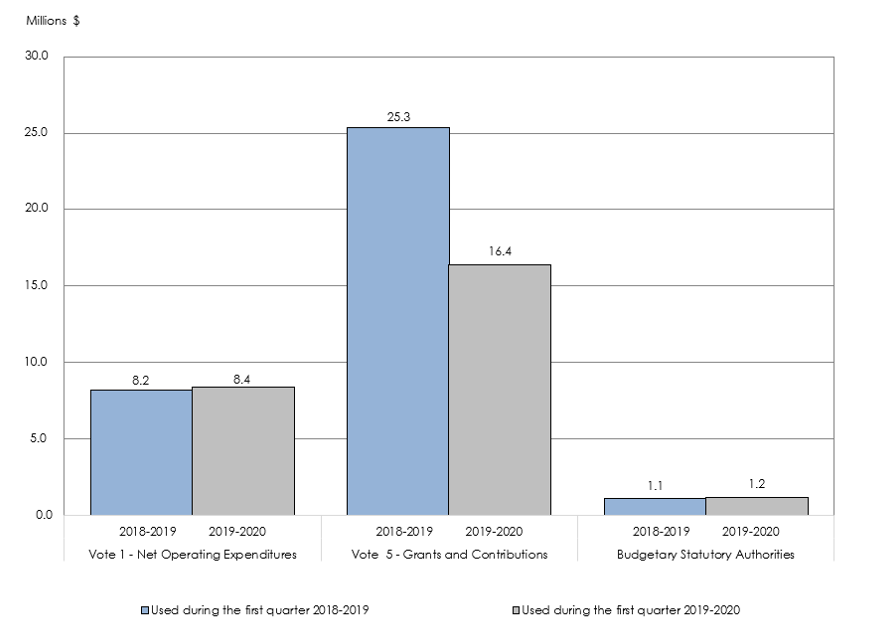
Graph 2 - Long description
Analysis of first quarter expenditures and presentation of year-to-date expenditures by budgetary appropriation as at June 30, fiscal year 2019–2020, compared with 2018 2019: subdivided into three sections, namely Vote 1 – Net Operating Expenditures, Vote 5 – Grants and Contributions, and Budgetary Statutory Authorities. This graph shows expenditures incurred during the first quarter of 2019–2020 and includes a comparison with fiscal year 2018–2019.
In the first quarter of 2019–2020, expenditures under Vote 1 (Net Operating Expenditures), Vote 5 (Grants and Contributions), and Budgetary Statutory Authorities, amounted to $8.4M ($8.2M in 2018–2019), $16.4M ($25.3M in 2018–2019) and $1.2M ($1.1M in 2018–2019), respectively.
Vote 1 expenditures (Net Operating Expenditures)
Net Operating Expenditures for the first quarter of 2019-2020 and the first quarter of 2018-2019 stood at $8.4M and $8.2M, respectively.
The variance of $0.2M (2.4%) is deemed insignificant.
(For further details on expenditures, see the table entitled Departmental Budgetary Expenditures by Standard Object in Appendix 6.2.)
Vote 5 expenditures (Grants and Contributions)
In the first quarter of 2019-2020, CED spent $16.4M in grants and contributions, a decrease of $8.9M (35.2%) from the first quarter of 2018-2019; $8.2M of this amount was solely in the Community Futures Program (CFP).
Agreements under the CFP were renewed in the first quarter of 2019-2020. Since these agreements were not in force, payments could not begin in the first quarter. Disbursements from the CFP will commence in the second quarter of 2019-2020.
(For further details on expenditures, see the table entitled Departmental Budgetary Expenditures by Standard Object in Appendix 6.2.)
3. Risks and Uncertainties
To achieve its results, CED needs to have an overview of the changing factors that have a marked impact on its environment and activities. It integrates these factors into its decision-making processes. Incorporating risk management in departmental planning allows CED to implement appropriate risk management strategies in order to achieve its results.
CED has a mandate to promote economic development; therefore, its principal external risk is linked to its ability to adapt the delivery of its mandate in a changing economic environment. Many factors, such as the strengthening of the global economy, the interdependence of global risks, variation in the number of investment projects undertaken by businesses in the regions because of the vulnerability of some regions owing to the state of the economy, numerous technological and policy changes, as well as changes in market measures affecting trade on world markets, are likely to have an impact on delivery of the organization’s mandate. These external factors may limit CED’s ability to achieve its expected results, including the creation of new businesses and the expansion of existing ones. To mitigate this risk, CED will, for example, continue to develop and implement regional strategies and special initiatives to address region-specific issues, based on its budget availabilities.
The obsolescence of the financial system poses a risk to the integrity of the financial data available for decision-making purposes. In addition to its work to implement a new financial management system (SAP), CED has introduced mitigation strategies, including evaluation of infrastructure elements by transformation project and planning of alternative options; monitoring of requests for technological infrastructure services and timetables; renewal of its technological tool assets; and maintenance of an effective and serious relationship with partners in the delivery of technological services.
CED manages its resources within a well-defined framework of responsibilities, policies and procedures, including an appropriate budget and reporting system and other controls allowing it to manage its operations within the limits of available resources and parliamentary authorizations. It regularly monitors the progress and effectiveness of their implementation through a number of budgetary review processes and activities, together with monthly analysis of expenditures and budgetary estimates by organizational unit. Financial risks are mitigated in large part by the implementation of strong internal controls over financial reporting. CED conducts periodic assessments such as entity controls, general IT controls, and business process controls.
4. Significant changes in operations, staff and programs
On April 1, 2019, CED introduced a new Program Inventory to better reflect its activities. The programs involved are Regional Innovation, Community Vitality and Targeted or Temporary Support.
In 2019-2020, CED received supplementary funding for temporary initiatives of one year or more:
- Steel and Aluminum Initiative;
- Women’s Entrepreneurship Strategy (supplementary funds envelope);
- Canadian Experiences Fund.
Some major departmental and government-wide projects are under way that will help to enhance the client experience, modernize methods, and create a stimulating work environment. These initiatives include the creation of an innovation incubator, implementation of the digital strategy, and development of a new common platform of grants and contributions management.
5. Approval of senior officials
The purpose of this section is to provide the approval of senior officials, as required by the Policy on Financial Management, as follows:
Approved by:
_____________________________________
Manon Brassard
Deputy Minister/President
Montréal, Canada
August 12, 2019
__________________________________
Guy Lepage
Chief Financial Officer
Montréal, Canada
August 5, 2019
6. Appendices
6.1 Statement of Authorities (unaudited)
| Total available for use for the year ending March 31, 2020* | Used during the quarter ended June 30, 2019 | Year to date used at quarter-end | |
|---|---|---|---|
| Vote 1 – Net Operating Expenditures | 39,452 | 8,413 | 8,413 |
| Vote 5 – Grants and Contributions | 274,903 | 16,417 | 16,417 |
| Total Budgetary Statutory Authorities | 4,877 | 1,213 | 1,213 |
| Total authorities | 319,232 | 26,043 | 26,043 |
| Total available for use for the year ending March 31, 2019* | Used during the quarter ended June 30, 2018 | Year to date used at quarter-end | |
|---|---|---|---|
| Vote 1 – Net Operating Expenditures | 38,634 | 8,240 | 8,240 |
| Vote 5 – Grants and Contributions | 233,365 | 25,335 | 25,335 |
| Total Budgetary Statutory Authorities | 4,506 | 1,126 | 1,126 |
| Total authorities | 276,505 | 34,701 | 34,701 |
* Includes only authorities available for use for the year and granted by Parliament at quarter end.
6.2 Departmental budgetary expenditures by Standard Object (unaudited)
| Planned expenditures for the year ending March 31, 2020* | Expenditures during the quarter ended June 30, 2019 | Year to date used at quarter-end | |
|---|---|---|---|
| Expenditures: | |||
| Staff* | 36,682 | 8,559 | 8,559 |
| Transport and communication | 910 | 232 | 232 |
| Information | 308 | 37 | 37 |
| Professional and special services | 4,768 | 286 | 286 |
| Leasing | 571 | 298 | 298 |
| Repair and maintenance services | 22 | 7 | 7 |
| Public utilities, materials and supplies | 237 | 16 | 16 |
| Acquisition of land, buildings and works | 0 | 0 | 0 |
| Acquisition of equipment and tools | 827 | 20 | 20 |
| Transfer payments | 274,903 | 16,418 | 16,418 |
| Other grants and payments | 4 | 170 | 170 |
| Total net budgetary expenditures | 319,232 | 26,043 | 26,043 |
* Includes employee benefit plans (EBPs)
| Planned expenditures for the year ending March 31, 2019* | Expenditures during the quarter ended June 30, 2018 | Year to date used at quarter-end | |
|---|---|---|---|
| Expenditures: | |||
| Staff* | 34,148 | 8,101 | 8,101 |
| Transport and communication | 1,010 | 152 | 152 |
| Information | 442 | 30 | 30 |
| Professional and special services | 4,759 | 712 | 712 |
| Leasing | 692 | 205 | 205 |
| Repair and maintenance services | 36 | 3 | 3 |
| Public utilities, materials and supplies | 204 | 26 | 26 |
| Acquisition of land, buildings and works | 0 | 0 | 0 |
| Acquisition of equipment and tools | 1,831 | 67 | 67 |
| Transfer payments | 233,365 | 25,335 | 25,335 |
| Other grants and payments | 18 | 70 | 70 |
| Total net budgetary expenditures | 276,505 | 34,701 | 34,701 |
* Includes employee benefit plans (EBPs)
- Date modified: