Quarterly Financial Report ended September 30, 2016
Official title: Employment and Social Development Canada, Quarterly Financial Report - Statement Outlining Results, Risks and Significant Changes in Operations, Personnel and Programs for the Quarter Ended September 30, 2016.
On this page
- 1. Introduction
- 2. Highlights of Fiscal Quarter and Fiscal Year-to-Date (YTD) results
- 3. Risks and uncertainties
- 3.1 Privacy/Security of Personal Information
- 3.2 Human Resource Management
- 3.3 Information Technology Sustainability
- 4. Significant changes in operations, personnel and programs
- 5. Approval by senior officials
- Table 1: Statement of authorities (unaudited)
- Table 2: Departmental budgetary expenditures by standard object (unaudited)
1. Introduction
This quarterly report has been prepared by management as required by section 65.1 of the Financial Administration Act and in the form and manner prescribed by the Treasury Board. This quarterly report should be read in conjunction with the Main Estimates for the current year.
1.1 Authority, mandate and programs
The mission of Employment and Social Development Canada (ESDC), including the Labour Program and Service Canada, is to build a stronger and more competitive Canada, to support Canadians in making choices that help them live productive and rewarding lives and to improve Canadians’ quality of life.
ESDC delivers a range of programs and services that affect Canadians throughout their lives. The Department provides seniors with basic income security, supports unemployed workers, helps students finance their post-secondary education and assists parents who are raising young children. The Labour Program is responsible for labour laws and policies in federally regulated workplaces. Service Canada helps citizens access ESDC’s programs, as well as other Government of Canada programs and services.
The Minister of Families, Children and Social Development, the Minister of Employment, Workforce Development and Labour and the Minister of Sport and Persons with Disabilities are responsible for this organization.
To fulfill its mission, the Department is responsible for:
- developing policies that ensure all can use their talents, skills and resources to participate in learning, work and their community;
- delivering programs that help Canadians move through life’s transitions, from school to work, from one job to another, from unemployment to employment, from the workforce to retirement;
- providing income support to seniors, families with children and those unemployed due to job loss, illness or caregiving responsibilities;
- helping Canadians with distinct needs such as Indigenous people, persons with disabilities, homeless people, travelers and recent immigrants;
- overseeing federal labour responsibilities; and
- delivering programs and services on behalf of other departments and agencies.
Included in these core roles are responsibilities for the design and delivery of some of the Government of Canada’s most well-known programs and services, including:
- Old Age Security (OAS);
- the Canada Pension Plan (CPP);
- Employment Insurance (EI);
- Canada Student Loans and Grants;
- the Canada Education Savings Program;
- the Wage Earner Protection Program; and
- passport services.
These direct benefits to Canadians are part of Canada’s social safety net and represent 95 percent of the Department’s expenditures.
Further details on ESDC’s authority, mandate and programs may be found in Part II of the Main Estimates and in the Report on Plans and Priorities.
1.2 Basis of presentation
This quarterly report has been prepared by management using an expenditure basis of accounting. The accompanying Statement of Authorities (Table 1) includes ESDC’s spending authorities granted by Parliament, consistent with the Main Estimates and the budgetary authorities used by the Department for the 2016–17 fiscal year. This quarterly report has been prepared using a special-purpose financial reporting framework designed to meet financial information needs with respect to the use of spending authorities.
The authority of Parliament is required before moneys can be spent by the Government. Approvals are given in the form of annually approved limits through appropriation acts or through legislation in the form of statutory spending authorities for specific purposes.
As part of the departmental performance reporting process, ESDC prepares its annual departmental financial statements on a full accrual basis in accordance with Treasury Board accounting policies, which are based on Canadian generally accepted accounting principles for the public sector. However, the spending authorities voted by Parliament remain on an expenditure basis.
The quarterly report has not been subject to an external audit or review.
1.3 ESDC’s financial structure
ESDC has a complex financial structure, with various funding mechanisms used to deliver its mandate. This includes budgetary authorities, comprised of voted and statutory authorities, as well as a non-budgetary authorities. The voted budgetary authorities include Vote 1 (Operating Expenditures), vote-netted revenues, and Vote 5 (Grants and Contributions), while the statutory authorities are mainly comprised of the Old Age Security Program, the Universal Child Care Benefit, the Canada Student Loans Program, the Canada Education Savings Program, the Canada Disability Savings Program, the Wage Earner Protection Program, Federal Workers’ Compensation and employee benefit plans (EBP). The non-budgetary authorities consist of loans disbursed under the Canada Student Financial Assistance Act and Apprentice Loans Act.
It should be noted that EI and CPP benefits and related administrative costs are administered through specified purpose accounts and not through appropriations from government. The EI Operating Account and the CPP are financed by employers and employees. Federal administrative costs incurred by departments in the delivery of programs related to EI and CPP are charged to the respective accounts and reported as revenues credited to the vote. The EI Operating Account and the CPP are excluded from ESDC’s Main and Supplementary Estimates. However, they are presented in the Report on Plans and Priorities. Accordingly, these accounts are not reflected in the Quarterly Financial Report.
2. Highlights of Fiscal Quarter and Fiscal Year-to-Date results
This section highlights the significant items that contributed to the net increase in resources available for the year and the net decrease in actual expenditures for the quarter ending September 30, 2016.
ESDC’s total budgetary authority available in the second quarter ending September 30, 2016 was $56,197 million, which represents an overall increase of $1,896 million from the previous year. Much of this increase relates to an increase in statutory items. Statutory items are payments to be made under legislation previously approved by Parliament and are non-discretionary. Total Year-to-Date (YTD) budgetary authorities used as of the second quarter ending September 30, 2016 were $28,716 million. In comparison, total YTD budgetary authorities used as of the second quarter of the previous year were $29,643 million, representing a year-over-year decrease of $927 million.
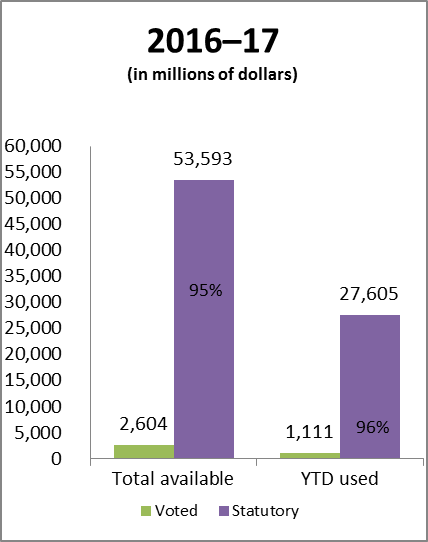
Text description of Figure 1: Quarter ended September 30, 2016
| Total available | % Total available | YTD used | % YTD Used | |
|---|---|---|---|---|
| Voted | 2,604 | 5% | 1,111 | 4% |
| Statutory | 53,593 | 95% | 27,605 | 96% |
| Total | 56,197 | 28,716 |

Text description of Figure 2: Quarter ended September 30, 2015
| Total available | % Total available | YTD used | % YTD Used | |
|---|---|---|---|---|
| Voted | 2,301 | 4% | 1,026 | 3% |
| Statutory | 52,000 | 96% | 28,617 | 97% |
| Total | 54,301 | 29,643 |
2.1 Significant changes to authorities
ESDC’s budgetary authorities available for use increased by $1,896 million compared to the second quarter of 2015–16 (Tables 1 and 2).
This increase is primarily associated with statutory items. In particular, forecasted OAS pension and Guaranteed Income Supplement (GIS) payments represent an increase of $2,165 million and $199 million respectively owing to changes in average benefit payments and in the number of beneficiaries. This increase is mainly offset by a decrease of $926 million from the UCCB, whose forecasts were adjusted to include payments made to recipients for only the months of April, May and June 2016. The UCCB has been replaced by the Canada Child Benefit announced in Budget 2016, starting in July 2016. Other factors contributing to the increase include:
- An increase of $260 million in Voted Grants and Contributions to fund government initiatives announced in Budget 2016, mainly due to the Canada Summer Jobs Program, the Social Infrastructure Fund and the Canada Job Fund;
- An increase of $67 million to Canada Disability Savings Grants and Bonds which is due to a steady increase in total registered plans and participation in the program;
- An increase of $49 million in the payments related to the direct financing arrangement under the Canada Student Financial Assistance Act and the direct financing arrangement under the Apprentice Loan Act mainly due to an increase to repayment assistance costs;
- An increase of $43 million in Operating Expenditures is mainly attributed to an increase in funding for the Temporary Foreign Workers Program to help ESDC respond to increased workloads due to changes in the program. Additional funding to support the Old Age Security Service Improvement Strategy is also a contributing factor in the increase of Operating Expenditures and so is a decrease in the carry-forward received in 2015-16 compared to the one received in 2014-15;
- An increase of $33 million in Employee Benefit Plan;
- An increase of $24 million in Canada Education Savings Grant payments due to more families saving for their children's post-secondary education; and
- A decrease of $30 million in Allowance payments due to a decreased number of beneficiaries and a decreased average monthly benefit amount compared to last fiscal year.
| (in millions of dollars) | |
|---|---|
| Total budgetary authorities available for use — 2015–16 | 54,301 |
| Changes to authorities available for use | |
| Old Age Security Payments | 2,165 |
| Vote 5 – Grants and Contributions | 260 |
| Guaranteed Income Supplement Payments | 199 |
| Canada Disability Savings Grants and Bonds | 67 |
| Direct financing under the Canada Student Financial Assistance Act and Direct financing under the Apprentice Loan Act | 49 |
| Vote 1 – Operating Expenditures | 43 |
| Employee Benefit Plans | 33 |
| Canada Education Savings Grants | 24 |
| Other | 12 |
| Allowance | (30) |
| Universal Child Care Benefits | (926) |
| Sub-Total - Changes to authorities available for use | 1,896 |
| Total budgetary authorities available for use — 2016–17 | 56,197 |
For non-budgetary loans, there is a net decrease in authorities of $47.4 million from fiscal year 2015–16, mainly resulting from a higher than originally forecasted volume of repayments against previously issued loans.
As shown in Table 2, total authorities related to Personnel expenditures have increased by $167 million mainly due to additional resources for measures to improve EI (announced as part of Budget 2016 on March 22, 2016), Overhauling the Temporary Foreign Worker Program, CPP workload and OAS Service Improvement Strategy and OAS Program Increased Workload Requirements.
The increase of $90 million related to Authorities recoverable from Employment Insurance Operating account is mostly related to measures to improve EI (announced as part of Budget 2016 on March 22, 2016) and the Mainframe Legacy Application Migration Project.
As well, variances to other operating expenditures (standard objects 02, 03, 04, 05, 06, 07 and 09) are the result of adjustments made to authorities available for use to bring them more in line with actual historical spending trends.
2.2 Significant changes to expenditures
Overall, the proportion of ESDC’s total budgetary expenditures as of September 30, 2016 is comparable to the usual spending presented at the second quarter, with approximately 51% of the authorities available for use expensed.
Compared to the previous year, total budgetary expenditures as of the quarter ending September 30, 2016 have decreased by $927 million (3.1%), from $29,643 million to $28,716 million (refer to Tables 1 and 2).
This 3.1% decrease is primarily explained by the decline in statutory expenditures from $28,617 million for the second quarter in 2015–16 to $27,605 million for the same period in 2016–17, representing a $1,012 million decrease as of the end of the second quarter 2016–17.
The main reason for this decrease is a reduction of $2,361 million that relates to the Universal Child Care Benefits, which was replaced by the new Canada Child Benefit introduced in Budget 2016 and effective July 1, 2016.
This large UCCB decrease is offset by increases to other statutory payments such as OAS pension payments which have increased by $792 million and GIS payments which have also increased by $380 million. The main factor explaining these increases is the aging population, thus the greater number of seniors receiving OAS and GIS benefits in addition to higher average amounts paid to beneficiaries.
In addition, Canada Student Grants payments have increased by as much as $119 million compared to the spending as at September 30, 2015 due to increased grant amounts for low-income, middle-income and part-time students announced as part of Budget 2016 and taking effect August 1st, 2016.
Canada Disability Savings Grant and Canada Disability Savings Bond payments have increased by $23 million and $17 million respectively, relative to the same period last year. These increases are mainly the result of the steady growth of the program and an increase in program beneficiaries.
As for the payments related to the direct financing arrangement under the Canada Student Financial Assistance Act, the increase of $10 million reflects the increases in repayment assistance costs.
And finally, the increase of $10 million for the allowance payments is mainly attributable to the increase in the top-up amount for the Allowance for the Survivor in July 2016.
Also contributing to the $927 million decrease is the increase of $81 million in Vote 5 — Grants and Contributions which is partly explained by the three following components; an increase of $32 million in payments related to the Labour Market Agreements for Persons with Disabilities, as the agreements with the provinces and territories were signed earlier in 2016-17 than last year. There is also an increase of $31 million for Youth Employment Strategy from the same period last year, as there were some delays in approving and implementing projects in 2015-16 due to the federal election. In addition, the Aboriginal Skills and Employment Training Strategy have increased by $14 million, relative to the same period last year.
| (in millions of dollars) | |
| Total budgetary authorities used as of September 30, 2015 | 29,643 |
| Changes in authorities used | |
| Universal Child Care Benefit | (2,361) |
| Old Age Security Payments | 792 |
| Guaranteed Income Supplement Payments | 380 |
| Canada Student Grant | 119 |
| Vote 5 — Grants and contributions | 81 |
| Canada Disability Savings Grants and Bonds | 40 |
| Direct Financing Arrangement under the Canada Student Financial Assistance Act | 10 |
| Allowance Payments | 10 |
| Other | 2 |
| Sub-Total - Changes in authorities used | (927) |
| Total budgetary authorities used as of September 30, 2016 | 28,716 |
In Table 1, the net amount of non-budgetary loans disbursed under the Canada Student Financial Assistance Act has decreased by $29 million at the end of the second quarter, primarily due to an increase in repayments and loan forgiveness
In Table 2, the decrease in professional services expenditures (standard object 04) is mostly attributable to the timing of payments rather than changes in spending patterns.
For injury compensation benefits related to the Government Employees Compensation Act (GECA), the $17.9 million decrease in net costs this second quarter compared to the second quarter of 2015-16 is mainly due to the lack of first quarter recoveries from Departments and agencies in 2015-16. The net costs of $21.8 million in 2016-17 are consistent with the GECA recoveries for second quarter.
3. Risks and uncertainties
The delivery of our programs and services is impacted by factors such as economic fluctuations, demographic shifts, technological developments and government priorities, to which the Department must respond accordingly. The Department has identified corporate-level risk and mitigation strategies for the 2016–17 fiscal year in the Risk Analysis section of the Report on Plans and Priorities.
The risks identified under each of the key risk areas below are the result of risk management self-assessment activities and independent reviews conducted by the Department. These risks will be monitored by senior management throughout the year to ensure adequate measures are implemented to mitigate their impacts.
3.1 Privacy/Security of Personal Information
There is an inherent risk of privacy breach that could have a significant impact on affected citizens given the nature of the Department’s work and the need for a very high level of security safeguards.
Risk response strategies:
- Continue to ensure robust privacy policies and processes and a strong approach to privacy management are in place;
- Use Shared Services Canada Internet gateways to adequately monitor and protect departmental networks;
- Ensure strong communications to staff on a variety of security requirements, including the safeguarding of information with a view to increasing awareness;
- Portfolio mission-critical services and their supporting IT applications and services are defined; each with corresponding business and IT service continuity plans developed and verified; and
- Physical and digital vulnerabilities are consistently identified and assessed against business impact and employee and public safety, resulting in proactive remediation plans.
3.2 Human Resource Management
Given high retirement/attrition rates, changing skillsets and capacity concerns, there is a risk that the Department will not be able to sustain a sufficient workforce or attract skilled employees with the appropriate competencies to meet current and future organizational needs.
Risk response strategies:
- Continue to integrate workforce planning into business planning to recruit skilled resources and strengthen workforce capacity; and
- Implement initiatives to enhance leadership development, recruitment and staffing, official languages, learning and mental health.
3.3 Information Technology Sustainability
Given the constantly evolving landscape of Information Technology (IT), there is a need for the Department to meet Canadians’ expectations of GoC services by continuing to rapidly advance technology while protecting private information. With this, there is a risk that IT may not be able to continuously transform, innovate, re-skill and invest at the nimble and flexible pace required to support ESDC programs and services.
Risk response strategies:
Through the use of the Departmental Business Capability Model and sound Application Portfolio Management practices, ESDC will:
- rationalize IT investments while ensuring alignment to strategic priorities for a timely and effective roll out of new online service delivery platforms; and
- continue to strengthen business continuity planning.
4. Significant changes in operations, personnel and programs
Budget 2016 introduced the new Canada Child Benefit, one simple, tax-free, and more generous benefit targeted to families who needs it most. The new, income-tested Canada Child Benefit has come into effect and replaces the UCCB since July 1, 2016.
The UCCB payments were made to eligible recipients only for the months of April, May, and June 2016, UCCB forecasted statutory payment for the full fiscal year 2016-17 has been reduced by $5.8 billion.
5. Approval by senior officials
Approved by:
Mark Perlman, Chief Financial Officer
November 25, 2016
Gatineau, Canada
Louise Levonian, Deputy Minister
November 28, 2016
Gatineau, Canada
Table 1: Statement of authorities (unaudited)
| Vote | (in thousands of dollars) | Fiscal year 2016–17 | Fiscal year 2015–16 | ||||
|---|---|---|---|---|---|---|---|
| Total available for use for the year ending March 31, 2017Footnote 1 | Used during the quarter ended September 30, 2016 | Year to date used at quarter-end | Total available for use for the year ending March 31, 2016Footnote 1 | Used during the quarter ended September 30, 2015 | Year to date used at quarter-end | ||
| 1 | Operating expenditures | 631,759 | 174,940 | 295,606 | 588,701 | 156,880 | 291,638 |
| 5 | Grants and contributions | 1,972,638 | 294,507 | 815,624 | 1,712,658 | 220,267 | 734,166 |
| (S) | Contributions to employee benefit plans | 266,027 | 60,427 | 120,854 | 233,299 | 56,840 | 113,680 |
| (S) | Minister of Families, Children and Social Development – Salary and motor car allowance | 84 | 28 | 35 | 82 | 21 | 41 |
| (S) | Minister of Employment, Workforce Development and Labour – Salary and motor car allowance | 84 | 28 | 35 | 82 | 21 | 41 |
| (S) | Minister of State (Seniors) – Motor car allowance | - | - | - | 2 | 1 | 1 |
| (S) | Minister of State (Social Development) – Motor car allowance | - | - | - | 2 | 1 | 1 |
| (S) | Old Age Security Payments (Old Age Security Act) | 37,086,490 | 9,475,681 | 18,828,244 | 34,920,970 | 9,061,367 | 18,036,593 |
| (S) | Guaranteed Income Supplement Payments (Old Age Security Act) | 10,804,379 | 2,649,792 | 5,217,897 | 10,605,509 | 2,331,981 | 4,837,784 |
| (S) | Universal Child Care Benefit (Universal Child Care Benefit Act) | 1,924,955 | 45,231 | 1,942,569 | 2,851,433 | 3,625,645 | 4,303,782 |
| (S) | Canada Education Savings grant payments to Registered Education Savings Plan (RESP) trustees on behalf of RESP beneficiaries to encourage Canadians to save for post-secondary education for their children | 824,000 | 171,712 | 365,043 | 800,000 | 171,223 | 360,011 |
| (S) | Canada Student Grants to qualifying full and part-time students pursuant to the Canada Student Financial Assistance Act | 763,845 | 368,646 | 430,496 | 756,113 | 257,894 | 311,262 |
| (S) | Payments related to the direct financing arrangement under the Canada Student Financial Assistance Act | 705,088 | 81,480 | 132,651 | 658,646 | 74,731 | 122,821 |
| (S) | Allowance Payments (Old Age Security Act) | 515,878 | 125,653 | 257,108 | 545,938 | 119,560 | 247,325 |
| (S) | Canada Disability Savings Grant payments to Registered Disability Savings Plan (RDSP) issuers on behalf of RDSP beneficiaries to encourage long-term financial security of eligible individuals with disabilities | 322,900 | 57,219 | 138,104 | 266,900 | 46,442 | 115,278 |
| (S) | Canada Disability Savings Bond payments to Registered Disability Savings Plan (RDSP) issuers on behalf of RDSP beneficiaries to encourage long-term financial security of eligible individuals with disabilities | 142,200 | 20,199 | 49,491 | 131,000 | 12,630 | 32,273 |
| (S) | Canada Learning Bond payments to Registered Education Savings Plan (RESP) trustees on behalf of RESP beneficiaries to support access to post-secondary education for children from low-income families | 133,000 | 68,720 | 88,583 | 130,000 | 62,421 | 80,204 |
| (S) | Wage Earner Protection Program payments to eligible applicants owed wages and vacation pay, severance pay and termination pay from employers who are either bankrupt or in receivership as well as payments to trustees and receivers who will provide the necessary information to determine eligibility | 49,250 | 5,758 | 11,490 | 49,250 | 6,833 | 14,193 |
| (S) | Payments of compensation respecting government employees (Government Employees Compensation Act) and merchant seamen (Merchant Seamen Compensation Act) | 44,000 | 8,265 | 21,839 | 44,000 | 18,201 | 39,694 |
| (S) | The provision of funds for interest and other payments to lending institutions and liabilities under the Canada Student Financial Assistance Act | 6,892 | 660 | 1,300 | 7,871 | 1,663 | 3,772 |
| (S) | Payment related to direct financing arrangement under the Apprentice Loans Act | 4,273 | 859 | 1,284 | 1,459 | 290 | 290 |
| (S) | Civil Service Insurance actuarial liability adjustments | 145 | - | - | 145 | - | - |
| (S) | Supplementary Retirement Benefits—Annuities agents' pensions | 35 | - | - | 35 | - | - |
| (S) | The provision of funds for interest payments to lending institutions under the Canada Student Loans Act | 1 | - | - | 3 | - | - |
| (S) | The provision of funds for liabilities including liabilities in the form of guaranteed loans under the Canada Student Loans Act | (4,080) | (1,721) | (2,107) | (5,333) | (2,278) | (2,095) |
| (S) | Spending of proceeds from the disposal of surplus Crown assets | 248 | 37 | 38 | 378 | 2 | 2 |
| (S) | Refunds of amounts credited to revenues in previous years | 45 | 7 | 45 | 188 | 28 | 188 |
| (S) | Spending pursuant to section 12(4) of the Canada Education Savings Act | 2,803 | - | 284 | 1,461 | 14 | 117 |
| Sub-total—Statutory items | 53,592,542 | 13,138,681 | 27,605,283 | 51,999,433 | 15,845,531 | 28,617,258 | |
| Total budgetary | 56,196,939 | 13,608,128 | 28,716,513 | 54,300,792 | 16,222,678 | 29,643,062 | |
| Non-Budgetary | |||||||
| (S) | Loans disbursed under the Canada Student Financial Assistance Act | 861,806 | 1,099,661 | 858,770 | 916,224 | 1,134,015 | 889,321 |
| (S) | Loans disbursed under the Apprentice Loans Act | 118,164 | 10,161 | 23,785 | 111,199 | 10,344 | 22,634 |
| Total Non-Budgetary | 979,970 | 1,109,822 | 882,555 | 1,027,423 | 1,144,359 | 911,955 | |
Table 2: Departmental budgetary expenditures by standard object (unaudited)
| (in thousands of dollars) | Fiscal year 2016–17 | Fiscal year 2015–16 | ||||
|---|---|---|---|---|---|---|
| Planned expenditures for the year ending March 31, 2017Footnote 1 | Expended during the quarter ended September 30, 2016 | Year to date used at quarter-end | Planned expenditures for the year ending March 31, 2016Footnote 1 | Expended during the quarter ended September 30, 2015 | Year to date used at quarter-end | |
| Expenditures | ||||||
| (01) Personnel | 1,921,963 | 471,607 | 914,399 | 1,754,603 | 442,709 | 873,616 |
| (02) Transportation and communications | 61,432 | 13,859 | 23,864 | 65,905 | 11,604 | 21,178 |
| (03) Information | 57,898 | 8,398 | 17,886 | 65,076 | 13,359 | 14,185 |
| (04) Professional and special services | 665,697 | 144,950 | 253,370 | 653,751 | 167,948 | 263,672 |
| (05) Rentals | 274,814 | 93,640 | 102,269 | 264,993 | 50,104 | 104,189 |
| (06) Repair and maintenance | 11,488 | 814 | 1,430 | 12,988 | 388 | 587 |
| (07) Utilities, materials and supplies | 9,591 | 1,572 | 2,607 | 9,341 | 1,670 | 2,818 |
| (09) Acquisition of machinery and equipment | 30,684 | 3,654 | 4,627 | 27,169 | 1,566 | 2,026 |
| (10) Transfer payments | 55,133,096 | 13,348,610 | 28,252,552 | 53,330,078 | 15,975,795 | 29,173,374 |
| (12) Other subsidies and payments | 4,573 | 265 | 315 | 3,360 | 155 | 678 |
| Total gross budgetary expenditures | 58,171,236 | 14,087,369 | 29,573,319 | 56,187,264 | 16,665,298 | 30,456,323 |
| Less: Revenues netted against expenditures | ||||||
| Recoverable expenditures on behalf of the Employment Insurance Operating Account | (1,364,722) | (336,179) | (631,602) | (1,274,866) | (308,326) | (608,371) |
| Recoverable expenditures on behalf of the Canada Pension Plan | (299,443) | (77,196) | (136,066) | (289,786) | (70,380) | (140,332) |
| Amounts recoverable from Crown agencies and other government departments regarding payments of injury compensation benefits | (114,566) | (32,755) | (47,932) | (128,334) | (28,352) | (28,792) |
| Other amounts recoverable from provincial and territorial governments, other departments or other programs within a department | (195,566) | (33,113) | (41,208) | (193,486) | (35,562) | (35,766) |
| Total revenues netted against expenditures | (1,974,297) | (479,243) | (856,808) | (1,886,472) | (442,620) | (813,261) |
| Total net budgetary expenditures | 56,196,939 | 13,608,126 | 28,716,511 | 54,300,792 | 16,222,678 | 29,643,062 |
Report a problem or mistake on this page
- Date modified: